

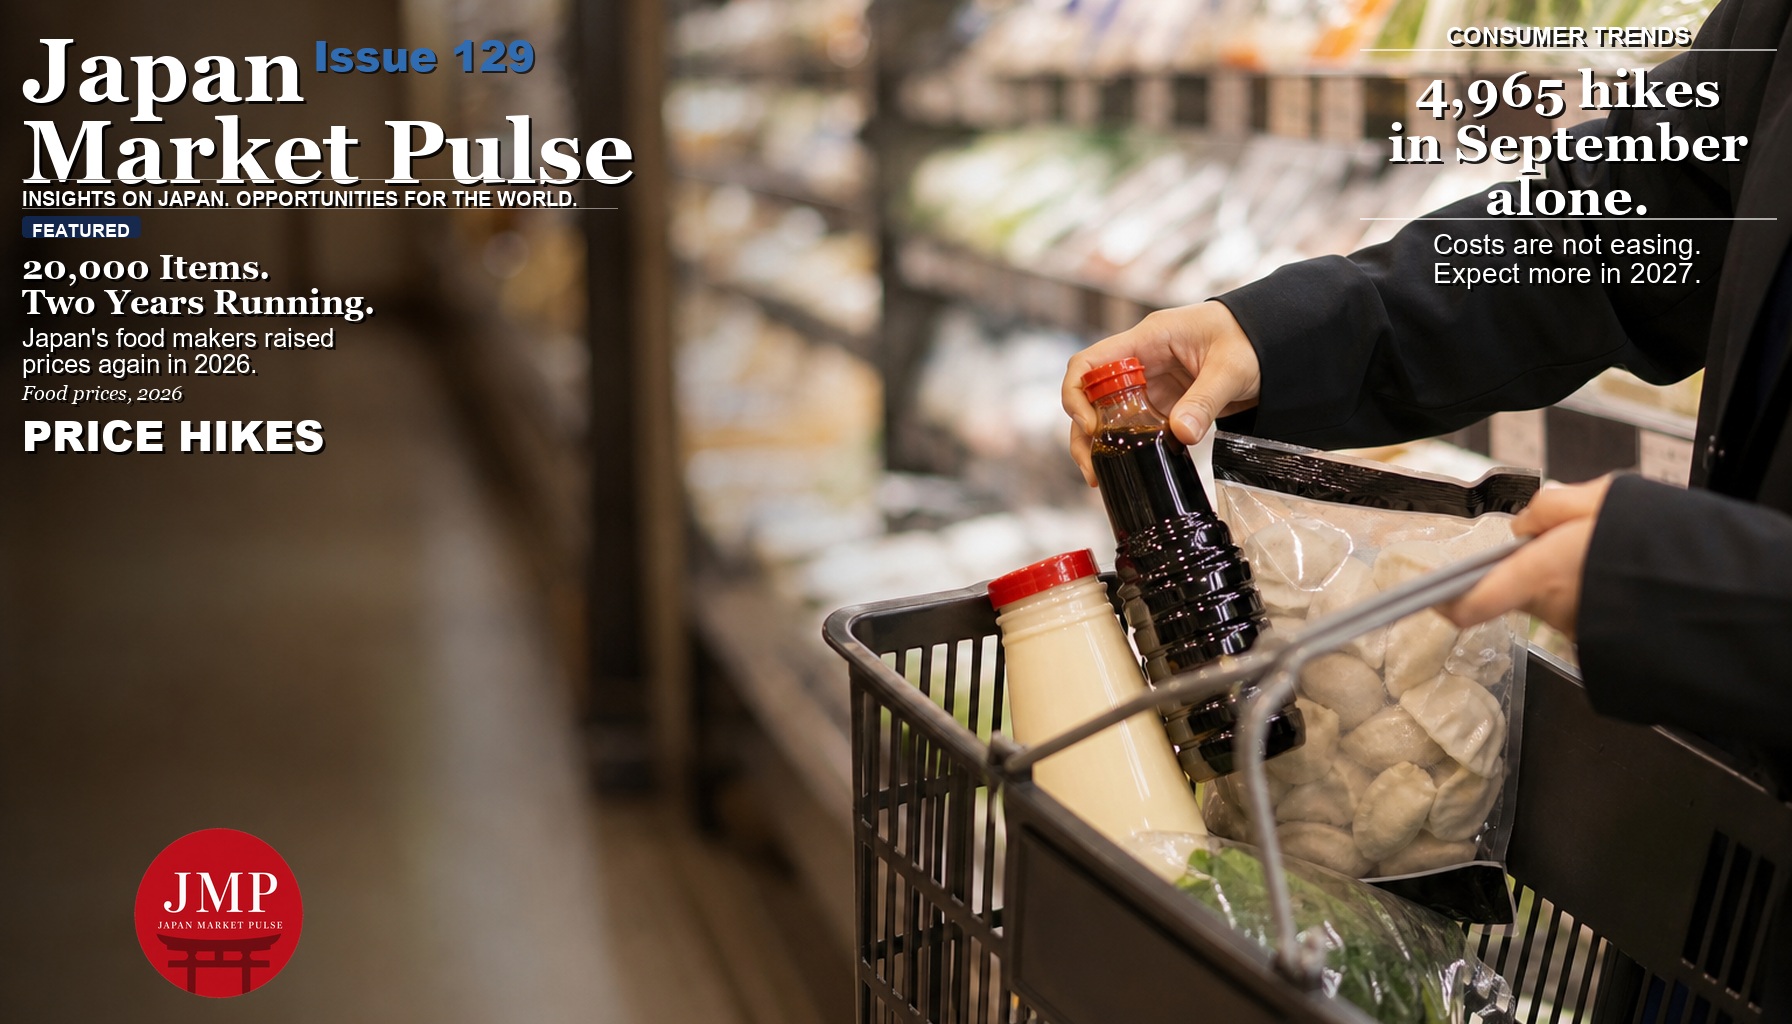
As of 30 September 2026, Japanese food and drink makers had announced price increases on 20,187 items for the year, counting those scheduled through December, the second year in a row above 20,000. Almost 40% of them landed in just two months, September and October. A Middle East oil shock, a weak yen and years of rising wages all pushed in the same direction, and the burden fell on everyday products: frozen meals, packaged rice, mayonnaise, soy sauce and beer-type drinks. The biggest wave appears to have peaked, but the cost pressure behind it has not gone away.
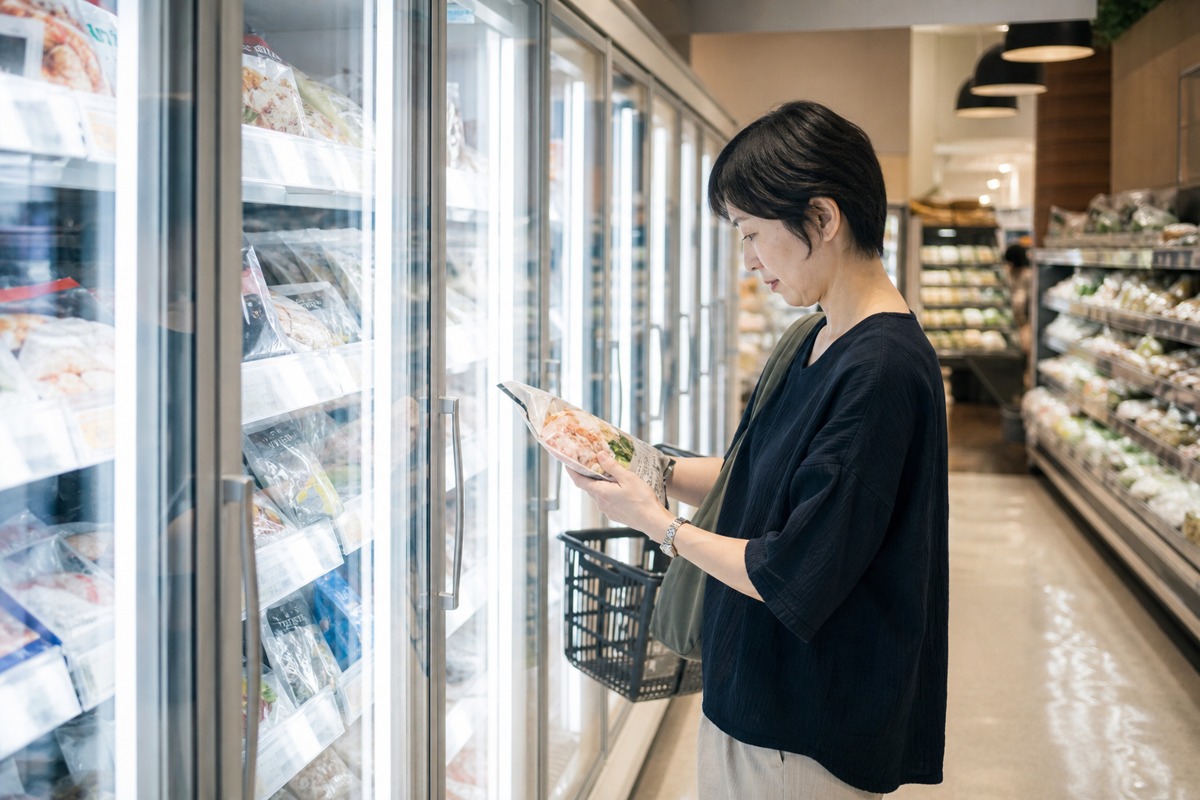
If you shop in a Japanese supermarket, you have noticed. A bottle of soy sauce, a pack of frozen gyoza or a six-pack of low-malt beer costs more than it did in the spring. If you sell food, drink or household goods into Japan, the numbers behind those price tags matter even more, because they describe the cost environment your Japanese partners are living in.
Every month, the credit-research firm Teikoku Databank tracks price increases announced by about 195 major food makers in Japan, mostly for products sold to households. Its report published on 30 September 2026 gives the clearest picture so far of what has happened this year. The headline is that 2026 has already matched 2025 as a 20,000-item year, and that the pace accelerated sharply in the second half.
This article walks through those numbers: how 2026 compares with the previous years, why autumn was so extreme, which categories took the hit, what is driving costs, and what international brands that sell in Japan, or buy from Japan, should do about it.
A 20,000-Item Year, Twice in a Row
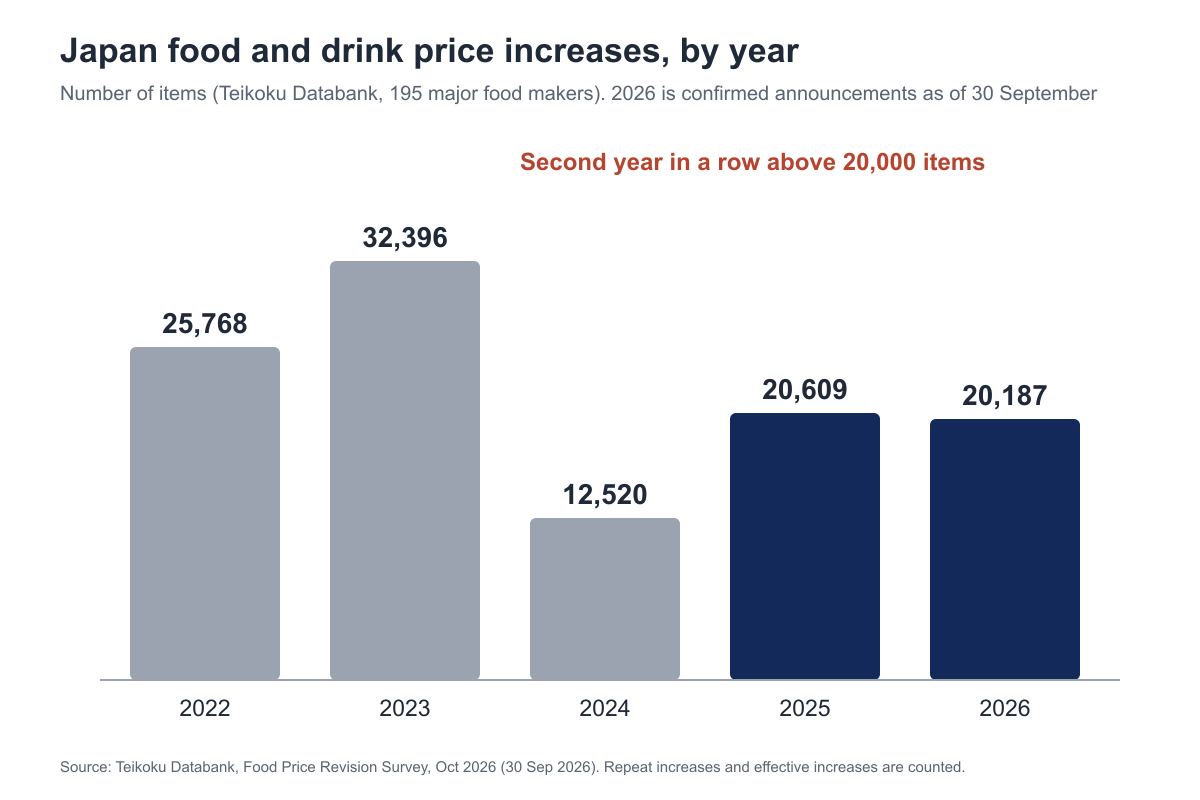
Teikoku Databank counts each price increase as one item. If a manufacturer raises the price of the same product twice in a year, it counts twice, and “effective” increases, where the price stays the same but the content shrinks, are counted as well. That makes the figure a measure of how many times Japanese consumers faced a higher price, not the number of unique products.
By that measure, the year-by-year totals look like this:
2022: about 25,800 items
2023: 32,396 items, the highest in the series
2024: 12,520 items
2025: 20,609 items
2026: 20,187 items confirmed so far, covering January to December announcements as of 30 September
The years 2022 and 2023 marked the first major post-pandemic repricing wave, driven by imported grain, energy and the yen. A calmer 2024 followed. In 2025 the count rose back above 20,000, and in 2026 it has done so again with three months of new announcements still to come. What looked like a one-time shock in 2022 and 2023 has become a recurring annual event.
The size of each step is modest: in October 2026 the average increase per announcement was about 10%. Many items are going up, with the October average increase at about 10%.
Why Autumn Was Extreme
The shape of the year matters as much as the total. Japanese manufacturers often concentrate increases in a few months, commonly April and October, when new budgets and contract cycles start. In 2026 the concentration was far stronger than usual.
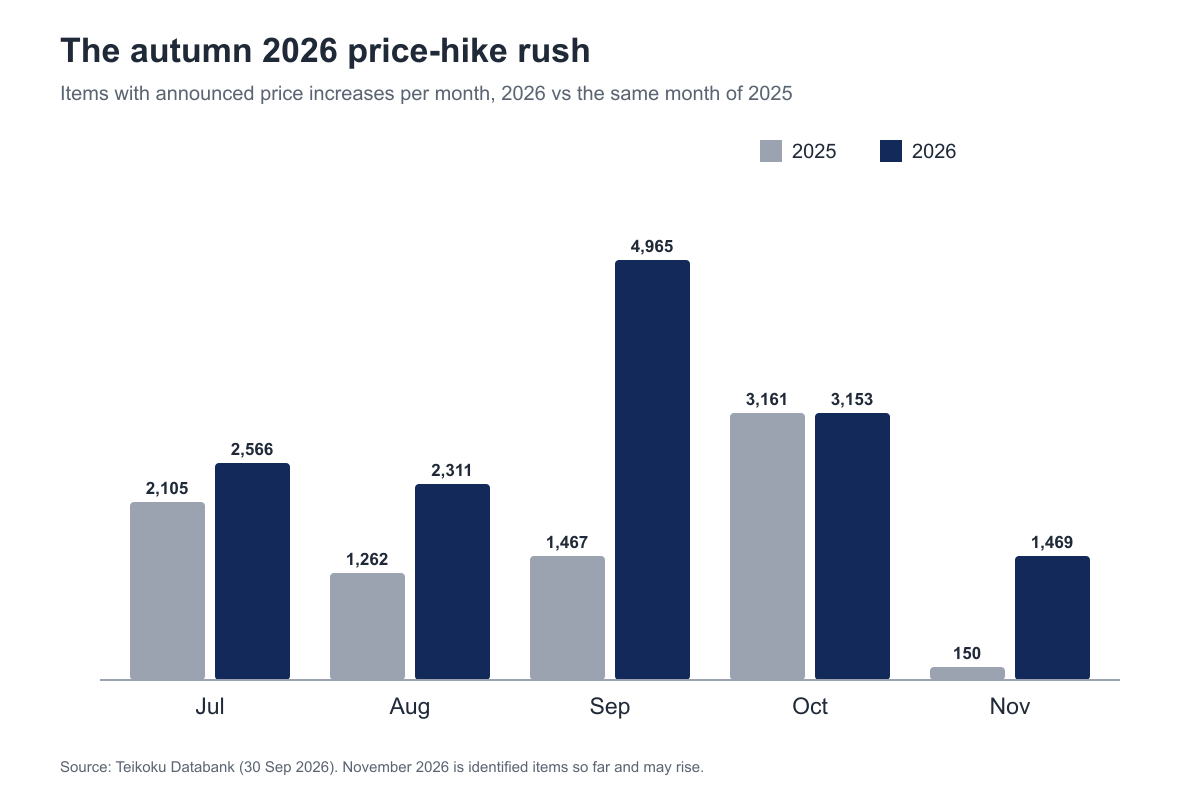
Teikoku Databank counted 4,965 items in September 2026 alone. That is the fourth-highest single month in the series since 2022, behind October 2022 (7,864), February 2023 (5,639) and April 2023 (5,404). It compares with 1,467 in September 2025, more than three times as many. October added 3,153 items, so September and October together passed 8,000, roughly 40% of the year’s tally. Widen the window to July onward and the share is about 70%.
The second half of 2026 against the same months of 2025:
July: 2,566 items, against 2,105 a year earlier
August: 2,311 items, against 1,262
September: 4,965 items, against 1,467
October: 3,153 items, level with 3,161
November: 1,469 items identified so far, against about 150
Two things stand out. First, October 2026 was essentially a repeat of October 2025, while September was the real outlier. Second, the November figure is about ten times last year’s, yet far below September or October. Teikoku Databank concludes that the 2026 rush peaked in October and is likely to ease for the rest of the calendar year.
The report also notes that October was the second consecutive month above 3,000 items, the first time that has happened since June and July 2023.
What Got More Expensive: The Category Breakdown
Spread across categories, 2026 looks different from 2025.
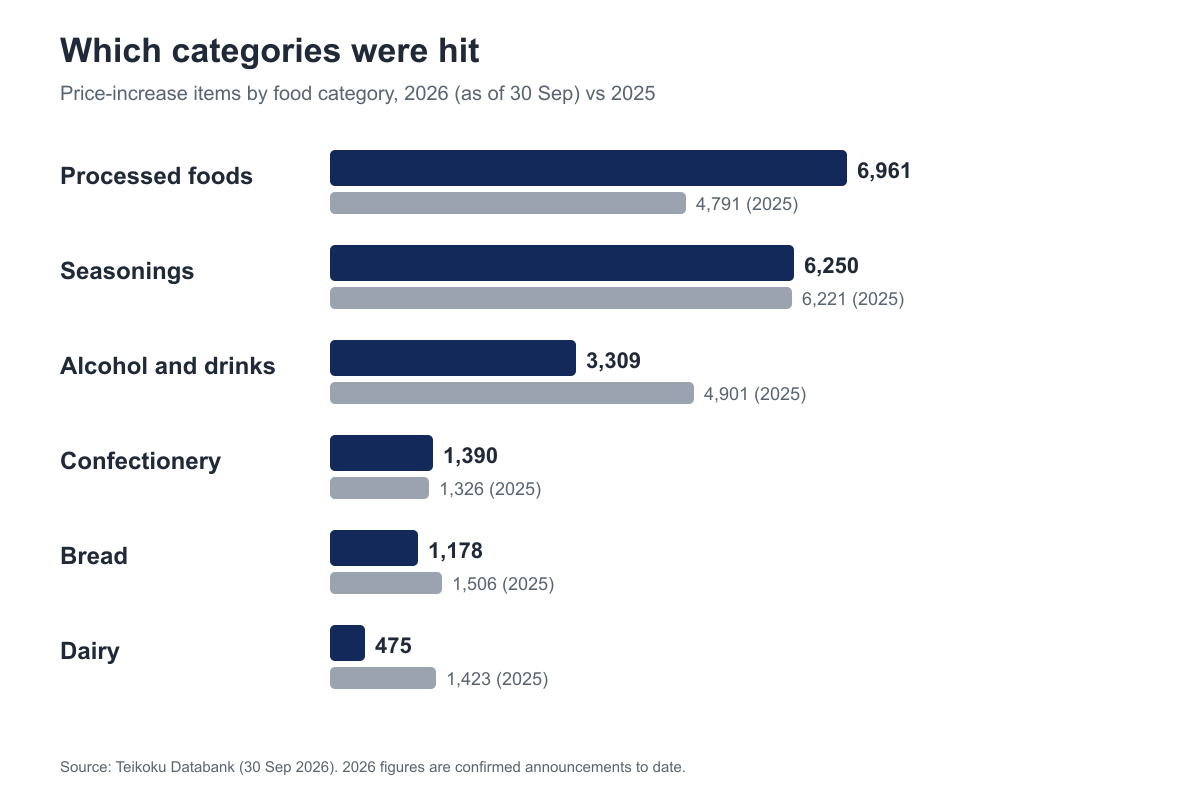
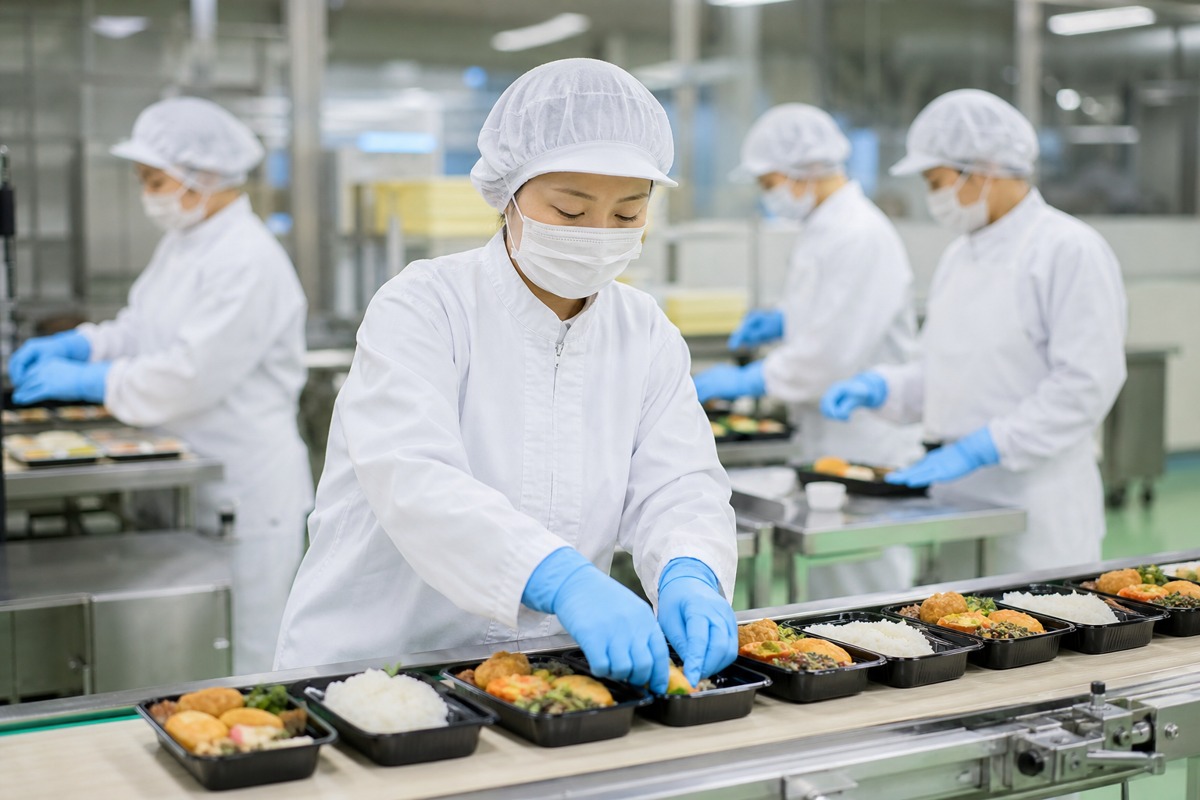
Processed foods led the year with 6,961 items, up from 4,791 in 2025, an increase of about 45%. The category covers frozen foods, packaged cooked rice, canned goods, chilled meals and baby food. These products rely heavily on packaging and cold-chain logistics, which makes them sensitive to oil, resin and transport costs.
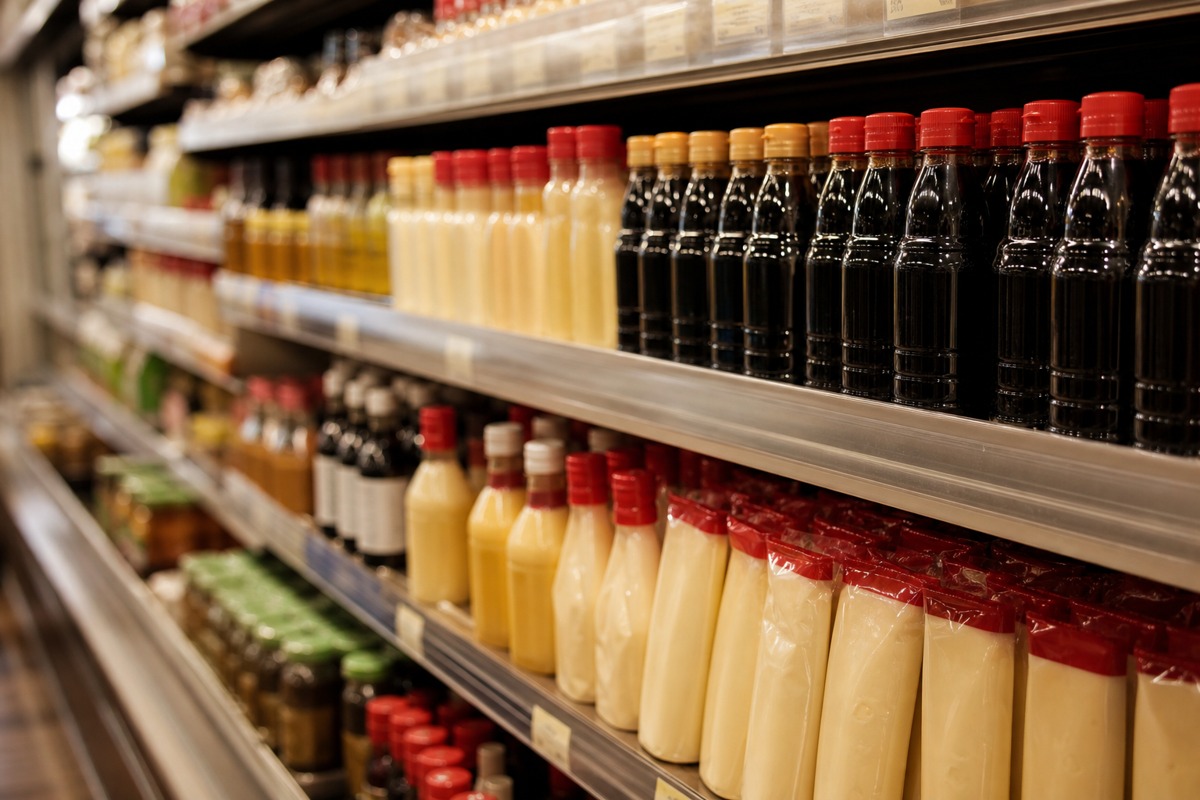
Seasonings followed with 6,250 items, essentially level with 2025’s 6,221. In October alone the category contributed 820 items, mainly mayonnaise, soy sauce and sauces. These are low-priced products bought often, so each increase is small in yen but visible in the weekly shop.
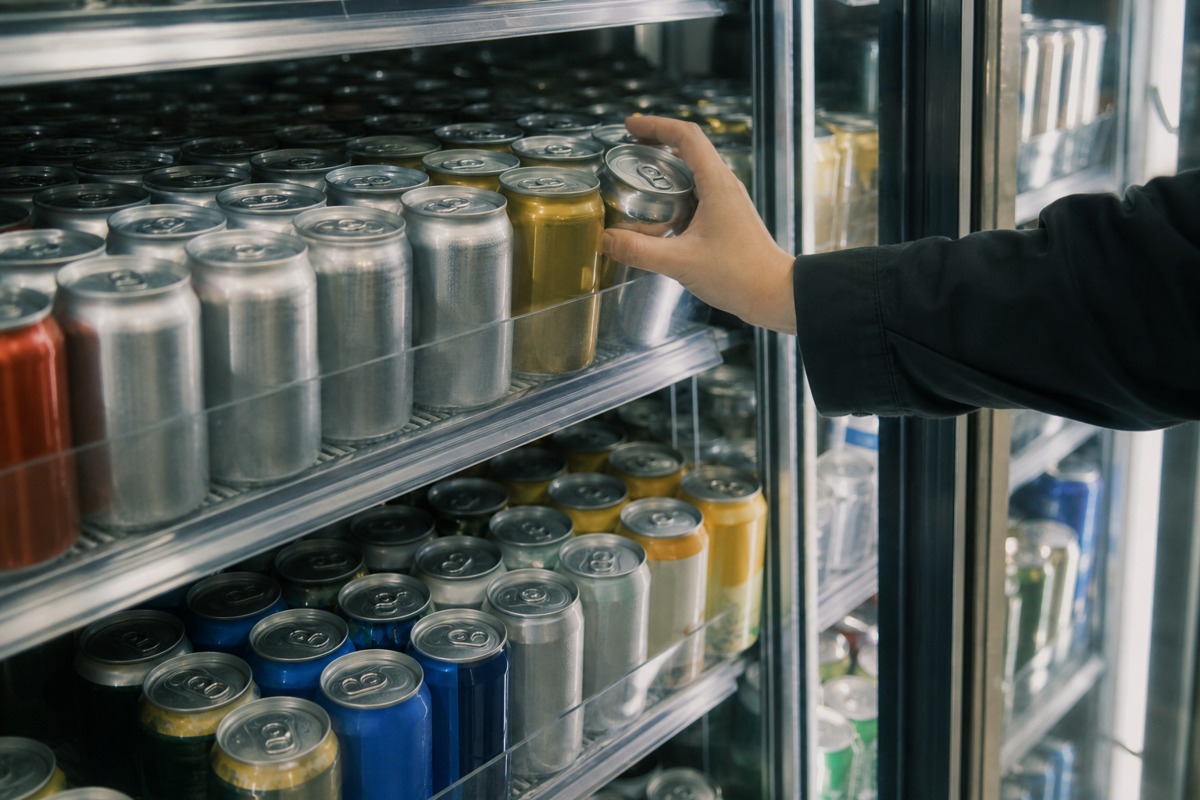
Alcohol and soft drinks came third at 3,309 items, down from 4,901 last year. October was an exception: 1,399 items, the largest category of the month and the first time drinks topped the chart since October 2025. The beer-type category was affected by Japan’s October liquor tax revision, while spirits such as shochu and soft drinks were also among the items raised.
Confectionery reached 1,390 items, slightly above 1,326 in 2025. Raw ingredients sold to the food industry rose from 441 to 624 items.
Not every category went up. Dairy fell from 1,423 items to 475, and bread from 1,506 to 1,178. Four categories exceeded their 2025 totals and the rest fell short. This year’s story is less a universal surge than a concentrated one in packaged, frozen and seasoning products.
The Cost Drivers: A Different Mix from Last Year
Teikoku Databank also records the reasons manufacturers give for each increase. Several can be cited at once, so the percentages add up to more than 100%.
Raw material costs: 91.3% of increases cited them, still the highest, but down from 96.1% in 2025.
Logistics: 66.0%, down from 78.6% in 2025.
Energy: 63.8%, unchanged from last year.
Packaging materials: 63.7%, up slightly from 62.7%.
Labour: 51.1%, nearly double the 26.5% recorded for 2024.
Middle East situation: 27.8%, a new category in 2026.
Weak yen: 8.1%, down from 12.4% in 2025 and 28.1% in 2024.
The most striking addition is the Middle East. After tensions in the region pushed up crude oil and naphtha prices, manufacturers began citing it directly. Teikoku Databank refers to a “naphtha shock”: naphtha is a feedstock for plastics, and plastics are in almost every food package. Packaging, film, trays and transport all got more expensive.
The second notable shift is labour. In 2024 about a quarter of price increases cited labour costs; in 2026 more than half do. That reflects years of wage increases and a shortage of workers in factories and logistics. Unlike a raw-material spike, labour costs rarely reverse when commodity prices fall. Teikoku Databank says domestic cost increases such as logistics and labour have become the norm.
The yen is cited less often than in earlier years, but the exchange rate has not helped: the report notes that the dollar has stayed above 150 yen, keeping import costs elevated.
Is the Peak Behind Us?
Teikoku Databank’s reading is cautious. The wave appears to have crested in October, and the November tally of 1,469 items is far below the autumn level. Some prices are easing: the report points to a fall in rice prices as one example of slowing inflation in a specific product.
But its outlook is blunt: price increases are expected to continue intermittently through 2027. The reasons it gives are the same factors an overseas company would use to forecast its own costs in Japan:
Tensions in the Middle East have no clear end in sight, so the naphtha-related cost increase has not reversed.
A yen weaker than 150 per dollar keeps imported ingredients expensive.
Heavy rain and drought are creating supply worries in agricultural, fishery and livestock products.
Price increases have not been enough to absorb costs fully, so food makers’ profits remain under pressure.
The increases are also spreading beyond food. The report notes that since July, price rises have broadened to eating out, daily necessities, household consumables and leisure. For Japanese households, the food bill is only one part of a rising cost of living.
Moderate Steps, Many Products
Three features of the 2026 data are worth separating out.
The first is the size of the steps. The October average of about 10% per announcement means shoppers face a series of moderate changes across many products rather than one dramatic jump.
The second is the way the count is built. Because “effective” increases through content reduction are included, a product whose price tag has not changed can still be in the statistics. When you compare your own product with a Japanese competitor, compare price per gram or per serving, not shelf price.
The third is timing. With 70% of the year’s increases announced from July onward, any contract negotiated in the first half of the year was priced before most of the pressure showed up. Retailers and distributors that signed on spring terms are now facing higher costs.
What International Operators Should Take From This
If you sell food, drink or household goods in Japan, or source from Japan, the 2026 data has several practical implications.
Expect to be asked about prices. Japanese distributors and retailers have faced more than 20,000 increase announcements in each of the past two years. If your contract is fixed in yen, expect the conversation, or expect to compete against brands that have already raised prices. Build a calendar: the heaviest months are April and October, and in 2026 September too.
Use the cost-driver list as a checklist. Packaging, energy and labour are cited more often than currency this year. If your product comes in plastic packaging, the naphtha factor applies to you regardless of where you manufacture.
Plan for frequent adjustments. With an average step of about 10% in October and increases spread across the year, a price strategy built on one annual reset may feel out of step with the market around it.
Look at where the pressure is concentrated. Processed foods, seasonings and drinks absorbed most of the increases, while dairy and bread saw fewer. If you are choosing which category to enter, the cost pressure on incumbents is part of the picture.
Compare on unit price. Because effective increases are counted, shelf price comparisons can mislead. Benchmark per unit of content.
Do not assume the peak means relief. Teikoku Databank expects intermittent increases through 2027. A planning assumption of stable prices after the autumn rush is not supported by the report.
Frequently Asked Questions
Q. How many food and drink price increases were there in Japan in 2026?
A. Teikoku Databank reported 20,187 items confirmed for 2026 as of 30 September 2026, covering announcements for January to December. That is the second year in a row above 20,000, after 20,609 in 2025. The count includes repeat increases of the same product and effective increases through reduced content.
Q. Which month had the most price increases?
A. September 2026, with 4,965 items, compared with 1,467 in September 2025. It was the fourth-highest month in the series since 2022. October added 3,153 items, and the two months together made up about 40% of the year so far.
Q. What is behind the price increases?
A. According to Teikoku Databank, 91.3% of increases cited raw material costs, 66.0% logistics, 63.8% energy, 63.7% packaging materials, 51.1% labour and 8.1% the weak yen. A new factor in 2026 is the Middle East situation, cited by 27.8% of increases, which pushed up oil and naphtha prices.
Q. Are prices still going to rise in 2027?
A. Teikoku Databank expects price increases to continue intermittently through 2027. The reasons it gives are the Middle East situation, a yen weaker than 150 per dollar, weather-related supply worries and thin margins at food makers. The report also notes that some prices, such as rice, are easing. Many Japanese snacks and seasonings are also available outside Japan through importers.
Q. Which food categories saw the biggest increases?
A. In 2026, processed foods lead with 6,961 items, up about 45% from 2025, followed by seasonings (6,250), alcohol and soft drinks (3,309) and confectionery (1,390). Dairy products and bread had fewer increases than in 2025.
Conclusion
The 2026 repricing wave is the second consecutive year in which Japanese food makers have raised prices on more than 20,000 items. What changed this year is the timing and the cause: a sharp autumn concentration, with September alone at 4,965 items, driven by oil-related packaging costs, labour and a weak yen.
The peak looks to be behind us, with November’s 1,469 items well below the autumn level. But the cost pressures that produced it remain, and the base case from the data is a continuing series of smaller increases through 2027. For international brands, the Japanese price environment is no longer an exception to be waited out. It is the operating condition for planning contracts, pricing and market entry.
If you’re interested in this topic, the Japanese market more broadly, or what KETCHUPs is working on, we’d love to hear from you — please reach out via our contact form.
Japan Market Pulse is a weekly read on what the Japanese consumer-tech, food, and mobility markets are choosing to do, written for international operators who want to know what is happening before it shows up in the global trade press.
Subscribe at ketchups.co/japan-market-pulse.