


Between January and September 2026, Japan welcomed 30.73 million foreign visitors, 2.9% fewer than a year earlier and the first decline over this period since 2021. Over the same nine months, those visitors spent an estimated 7.06 trillion yen, a record for the period. Chinese arrivals fell by more than half, Taiwan overtook China as the biggest spending market, and the average visitor now leaves behind about 234,000 yen per trip. The headline everyone expected was “inbound tourism cools”. The story the data actually tells is more useful for anyone selling to travellers: Japan has fewer customers, and each one is worth more.
For three years, the inbound-tourism story in Japan was a story about volume. Record months followed record months, and 2025 closed at an all-time high of 42.68 million visitors. Retailers, hotels and restaurants planned around the assumption that the crowds would simply keep growing.
Then, in 2026, the crowds stopped growing. Six of the first nine months came in below the same month a year earlier. Official warnings from Beijing against travel to Japan coincided with a drop of more than half in Chinese visitors, airfares rose, and typhoons cancelled flights. If you had stopped reading at the arrival numbers, you would have concluded that the boom was over.
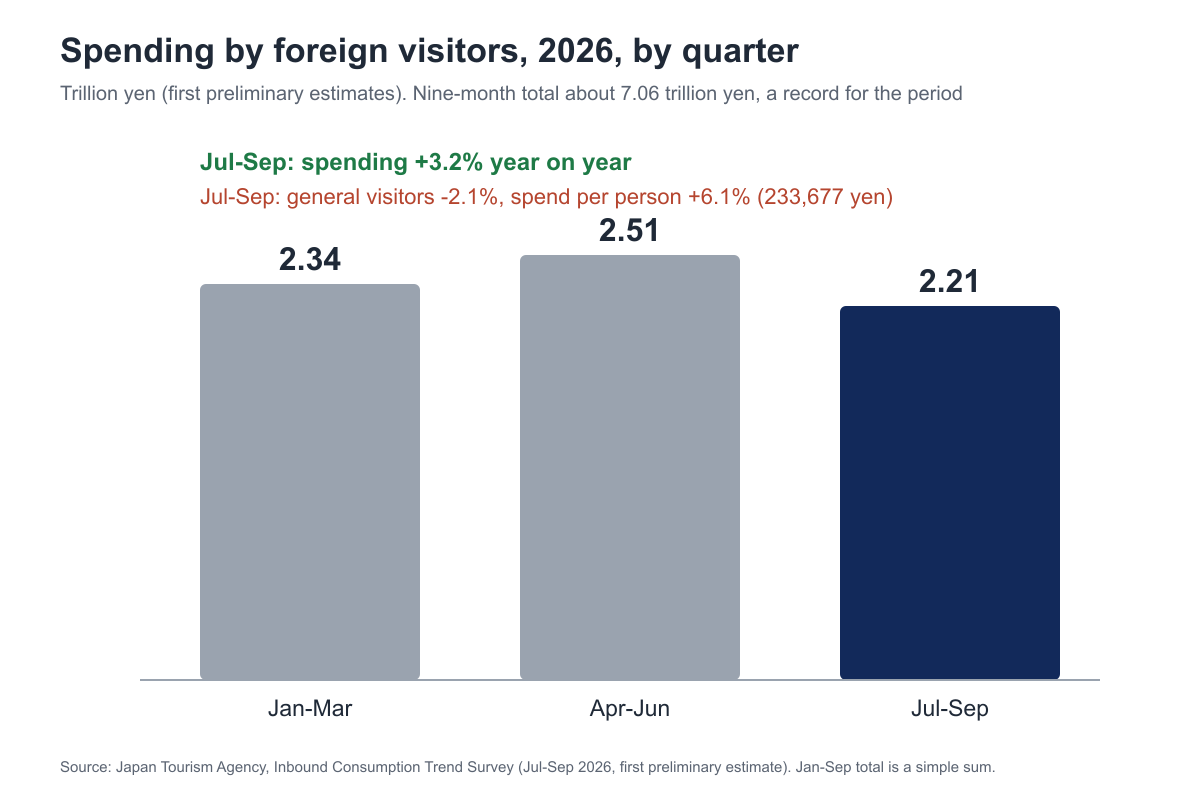
But the money did not leave. In the July-to-September quarter, spending by foreign visitors rose 3.2% year on year to 2.21 trillion yen, even though the number of general visitors in that quarter fell by 2.1%. This article walks through who stopped coming, who replaced them, why the average bill went up, and what the shift means for brands that sell to travellers in Japan.
Fewer Visitors, a Bigger Total: The Numbers
Two government sources describe the year so far. The Japan National Tourism Organization (JNTO) counts arrivals; the Japan Tourism Agency runs a quarterly survey that estimates how much visitors spend. Together they produce a picture that looks contradictory until you divide one number by the other.
According to JNTO, 30,730,200 foreign visitors arrived between January and September 2026, down 2.9% from the same period of 2025. September alone came in at 3.10 million, down 5.0% and the second consecutive monthly decline, which JNTO attributed to higher airfares and typhoon disruption. August had been worse, with a 9.6% drop to 3.09 million. July, by contrast, was the best July on record at 3.44 million, helped by strong Taiwanese and Korean travel.
The Tourism Agency’s quarterly estimates, in trillions of yen, are 2.34 for January to March, 2.51 for April to June and 2.21 for July to September. Added together, that is about 7.06 trillion yen, roughly 1.9% above the same nine months of 2025 and a record for the period. (The nine-month total is a simple sum of the agency’s quarterly releases, and the latest quarter is still a first preliminary estimate that will be revised.)
The reason the two lines point in different directions is spending per person. In the third quarter, the average general visitor spent 233,677 yen on the trip, 6.1% more than a year earlier. When arrivals slip about 2% and the average bill rises about 6%, the total grows. That is the whole mechanism, and the rest of this article is about why it happened and whether it can last.
China Falls Away: A 55.5% Drop in Arrivals

The largest single change in the market is the collapse of Chinese travel to Japan. For the nine months to September, arrivals from China were down 55.5% from the previous year. JNTO has pointed to repeated advisories from the Chinese government urging citizens to avoid travel to Japan as the cause. In the third quarter alone, the number of Chinese general visitors fell by 49.8%.
The financial impact is large because China had become the most important single source of spending. In the third quarter of 2025, Chinese visitors spent 595.0 billion yen, 27.8% of the total. In the same quarter of 2026 they spent 358.3 billion yen, down 39.8%, and their share dropped to 16.2%. That is roughly 237 billion yen of missing spending in a single quarter.
Note, though, that spending fell by less than the visitor count. The Chinese travellers who did come spent 294,560 yen each, up 22.1% from a year earlier and the second-highest of the five biggest markets after the United States. On leisure trips they spent 40,584 yen per night, more than any other major market. Shopping remains the biggest category for them at 143.8 billion yen in the quarter, around 40% of their total.
The lesson is not that Chinese demand has disappeared. It is that a market that had been 28% of spending can lose half its volume in a year while the overall total keeps growing. That fact alone should change how brands think about concentration.
Taiwan, Korea and Hong Kong Fill the Gap
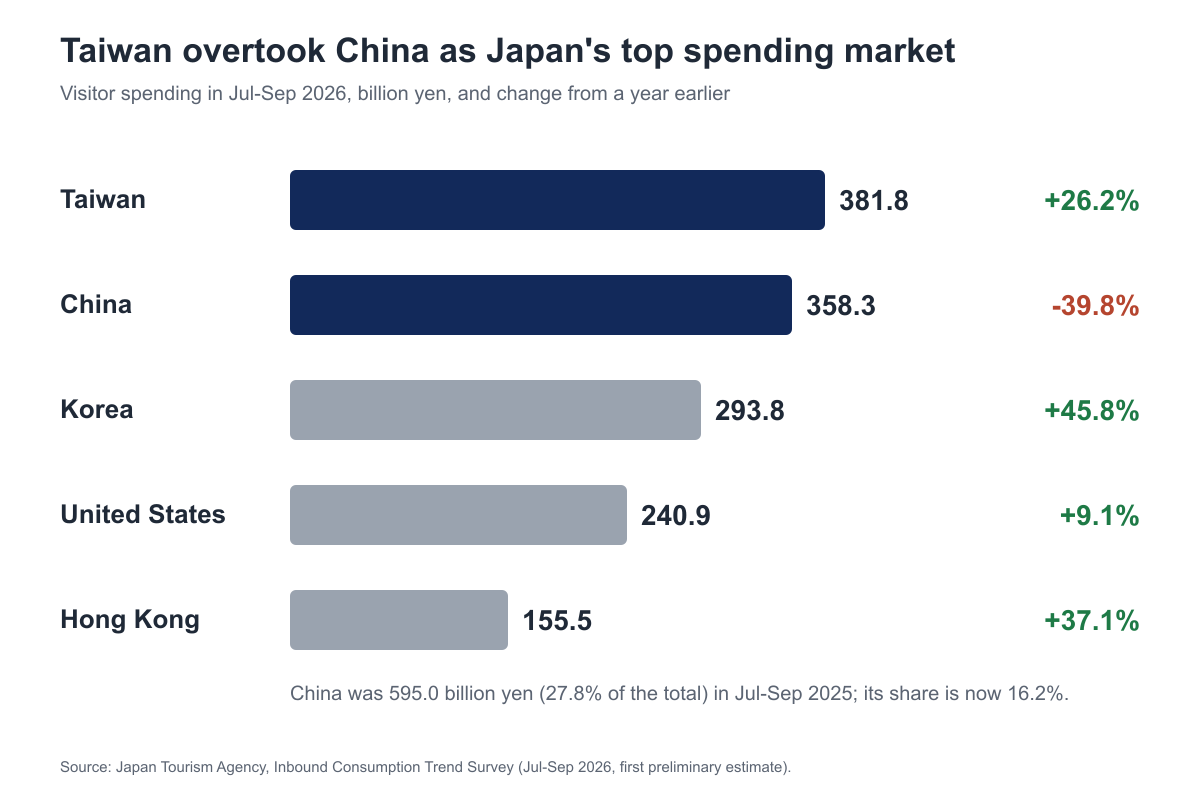
When China fell, three neighbouring markets rose. In the July-to-September quarter, Taiwan became the largest source of spending, at 381.8 billion yen, up 26.2%. China was second at 358.3 billion. Korea followed at 293.8 billion, a jump of 45.8%, then the United States at 240.9 billion (up 9.1%) and Hong Kong at 155.5 billion (up 37.1%).
Across the first nine months, Korean arrivals were up 21.6% and Taiwanese arrivals up 19.1%. Narita Airport has said its winter 2026 timetable has 3,382 weekly international passenger flights, with China routes reduced and Korea, Taiwan and Europe routes increased.
Several European markets also grew in the quarter: France was up 27.2%, Spain up 24.9% and Italy up 22.2%, while Germany fell 21.6%. The United States held up too, with per-person spending of 344,121 yen, up 8.2%.
But replacing China is not as simple as swapping one flag for another. Korean travellers spend the least per head of the five biggest markets: 113,959 yen per trip, roughly a third of what an American visitor spends. Taiwan is at 199,028 yen. A visitor from France spends 423,021 yen, the highest of any market in the survey.
The mix also changes what visitors buy. Taiwan’s biggest category is shopping (130.7 billion yen), which exceeded accommodation (116.1 billion). Americans spend the most on lodging (96.4 billion yen), then food (53.0 billion), then shopping (47.3 billion). Koreans spread their money fairly evenly across lodging, food and shopping. Which markets you target determines which products and services you should offer, and it is no longer enough to assume a single tourist profile.
The Same Visitor Now Pays More
The most interesting statistic in the data is not that spending rose but where it rose. It did not rise only because of a changing mix of nationalities. Inside nearly every major market, individual visitors spent more than they did a year ago: France up 22.6%, China up 22.1%, Korea up 13.4%, Hong Kong up 12.4%, Taiwan up 9.6%, the United States up 8.2%.
That is unusual, because the mix effect should have pushed the average down. China is a high-spending market and Korea a low-spending one, and the market shifted from the first towards the second. Despite that, the overall average rose 6.1%. In other words, the within-market increase was larger than the mix drag.
One explanation is price inflation in Japan. The national consumer price index for September 2026 was up 2.1% year on year, but hotel charges were up 4.6% and eating out was up 2.5%. Visitors, whose home currencies are in many cases still strong against the yen, have absorbed these increases. As one tourism-policy analyst put it in a recent Business Journal analysis, what has grown is visitors’ capacity to absorb Japanese inflation rather than the depth of their trips.
The length of stay supports this reading. The average stay for all visitors was 10.3 nights in the third quarter, 1.2 nights shorter than a year earlier, and 8.6 nights in the second quarter, down 0.8. If spending per trip is up while trips are shorter, spending per day has risen by more than the headline 6.1%. For leisure travellers, spending per person per night averaged 31,256 yen.
The mechanism is worth understanding because it cuts both ways. Hotels and restaurants have been able to raise prices without losing demand, which is good for margins. But it also means part of what looks like “better tourists” is really higher prices, and that part depends on the exchange rate staying favourable.
Shopping Is Back, Experiences Are Not (Yet)
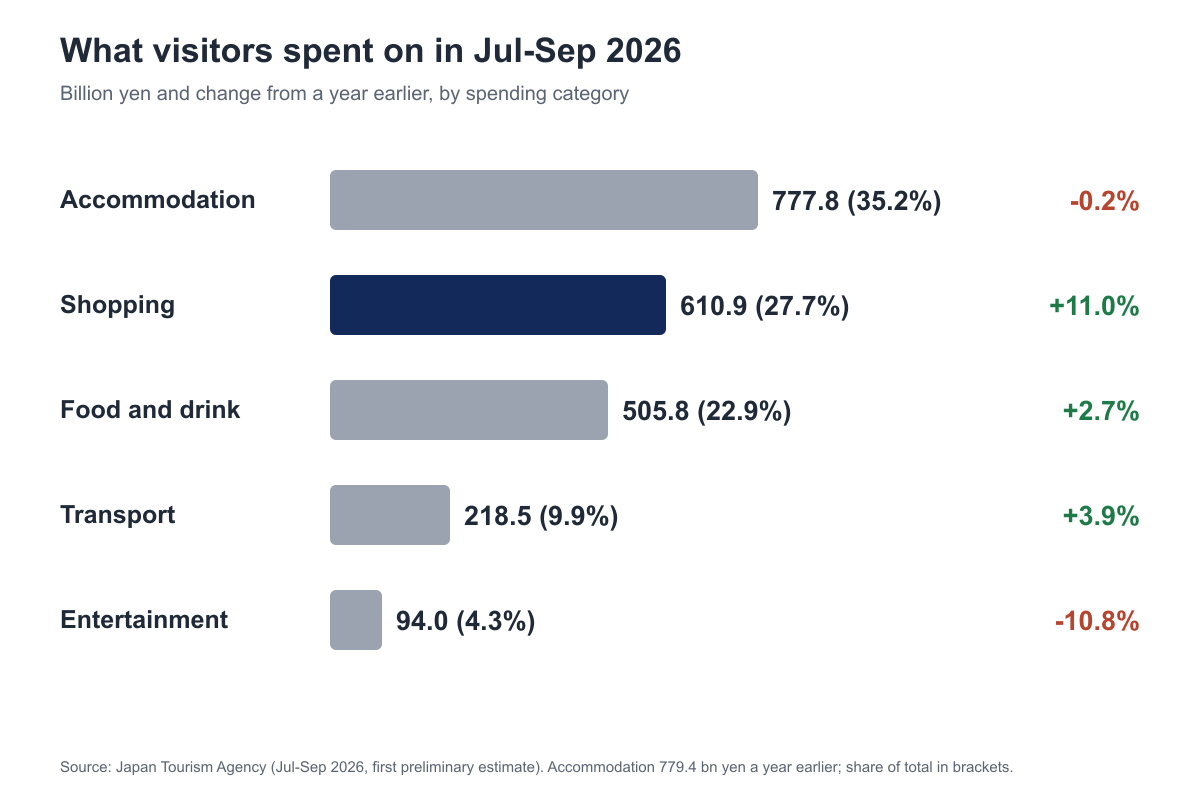
Breaking the third-quarter total down by category produces a few surprises. Accommodation was the largest at 777.8 billion yen (35.2% of the total), a hair below last year’s 779.4 billion. Shopping came second at 610.9 billion yen (27.7%), up 11.0% from 550.3 billion. Food and drink was 505.8 billion (22.9%), up 2.7%. Transport was 218.5 billion (9.9%), up 3.9%. Entertainment and services, the category that includes tours, shows and activities, was only 94.0 billion yen (4.3%) and fell 10.8%.
Two points stand out. First, retail has regained momentum. For some time it was fashionable to say that the era of bulk “bakubai” (explosive shopping) was over and experiences had taken its place. The numbers for this quarter say otherwise: shopping grew faster than any other category. What has probably changed is the content of the basket, from cartons of drugstore goods towards specific items a traveller has decided to find.
Second, the official figure for experience spending is misleading. A traveller who books a private visit to a sake brewery, tastes the product, buys a bottle and stays nearby has a single experience but a spend that gets split across shopping and lodging. One Business Journal analysis calls this “stealth” experience spending. The statistical categories do not capture it, and neither will your sales data unless you design your offering to bundle it.
Beyond Tokyo and Osaka: The Regional Shift
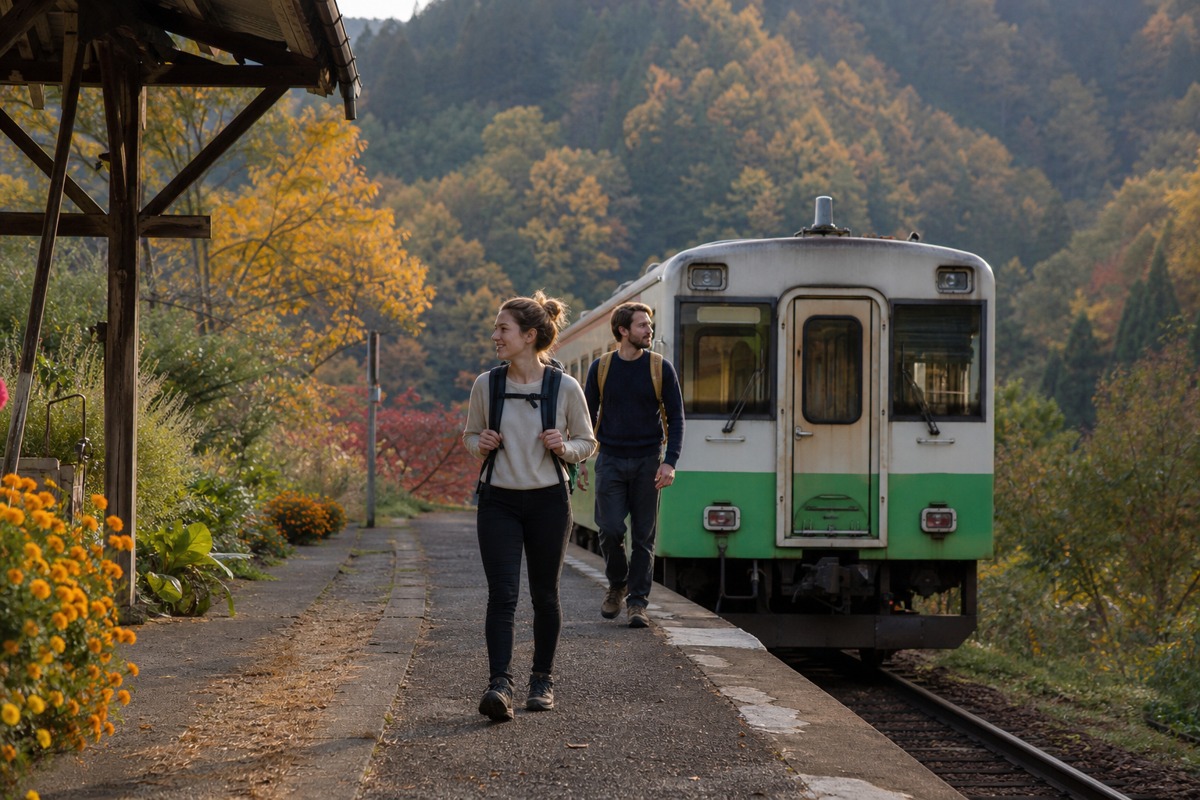
Another structural change is geographic. In 2025, according to the Japan Tourism Agency’s accommodation survey, overnight stays by foreign visitors in the three major metropolitan areas grew 5.1%, while stays in regional areas grew 19.1%. In August 2026, when visitor numbers fell, the three main metropolitan areas were down 15.6%, and regional areas were down only 4.9%. The regional share of overnight stays rose to 35.9%, 2.7 percentage points above a year earlier.
Some regional prefectures did far better than the national figure. Tochigi and Kochi recorded foreign overnight stays up about 90% in August, and Fukushima’s July figure was up 73.1%, the highest in the country that month.
The drivers are plausible. Repeat visitors who have already done Tokyo, Kyoto and Osaka look for new destinations, and snow resorts, islands in the Seto Inland Sea and renovated farmhouses reward people who accept more travel effort for something they cannot find at home.
For brands, this changes the geography of the opportunity. A product or service built only for Shibuya and Ginza footfall may be reaching a smaller slice of the visitor population than one distributed through regional airports, rail stations, local department stores and roadside stops.
The Risks Behind the Record
None of this means the record is secure. Four risks stand out in the data and the commentary around it.
The exchange rate. JNTO’s own notes say the yen has remained weak against many source-market currencies. That has cushioned Japanese price rises. If the yen strengthens, the same yen-denominated price becomes more expensive in foreign currency, and the willingness to absorb 4.6% hotel inflation has not been tested.
Concentration. China made up 21.2% of spending across 2025, and then lost 39.8% in a single quarter. A single market or a single political relationship can disappear quickly. The Korean and Taiwanese growth is encouraging, but both are lower-spend markets.
Capacity and service. Higher prices raise expectations. If staff shortages mean cleaning, service and multilingual support fall behind, visitors will notice, and reviews travel quickly. As the analyst quoted in the Business Journal piece put it, visitors do not object to higher prices as such; they object when the price rises and nothing else does.
Transport and global conditions. JNTO cited higher airfares linked to the situation in the Middle East and reduced flights as factors in September’s decline, and typhoons disrupted August and September. These are outside the control of anyone in Japan.
There is also a policy backdrop. In March 2026 the government kept its targets of 60 million visitors and 15 trillion yen in spending by 2030. Divide one by the other and you get about 250,000 yen per visitor. This year’s April-to-June average of 244,733 yen is already close to that, which suggests the target is being approached through price rather than volume.
What International Operators Should Take From This

If you sell products or services that touch inbound travellers, whether through a duty-free counter, a department store pop-up, an e-commerce shop that ships to hotels, or an experience you want to bring to Japan, the 2026 data suggests several practical adjustments.
Stop planning around arrivals. Visitor counts are the headline, but the metric that determines your revenue is spending per visitor in your category and among the nationalities you actually serve. A Korean visitor and a French visitor are different customers with a nearly fourfold difference in budget.
Diversify by market, not just by channel. If one nationality represents more than a quarter of your inbound sales, the Chinese experience of 2026 is the stress test you should run against your plan. Taiwan, Korea, Hong Kong, the United States and France all grew this year, but each buys differently.
Sell the specific, not the bulk. Shopping rose 11% in a quarter in which commentators describe undifferentiated bulk buying as largely over. Visitors appear to arrive with a short list of things they want, such as used cameras, vintage instruments, craft tools or regional food. Products with a clear story and a reason to be bought in Japan fare better than generic gifts.
Bundle experiences into the purchase. Because this kind of experience spending gets booked as shopping or lodging, the strongest offers combine a visit, a tasting or a making session with a product to take home. Entertainment-category revenue is falling on paper, but the value of such combinations shows up in the other lines.
Look outside the big-city circuit. Regional stays are falling more slowly than metropolitan ones. If you have a product that suits a regional town, a ski area or a ryokan, the competition for visitor attention is thinner there.
Price for value, not for today’s exchange rate. Domestic price rises have been absorbed so far partly because of currency. Build offers that still make sense if the yen strengthens, with a clear reason for the price beyond “it is Japan”.
Frequently Asked Questions
Q. Did tourism to Japan really decline in 2026?
A. In terms of visitor numbers, yes. Between January and September 2026, Japan received 30.73 million foreign visitors, 2.9% fewer than in the same period of 2025, according to JNTO. Six of the nine months were below the previous year. In terms of money, no: estimated spending for the nine months was about 7.06 trillion yen, roughly 1.9% higher than a year earlier and a record for the period.
Q. Why did Chinese visitors drop so sharply?
A. Arrivals from China fell 55.5% in the first nine months of 2026. JNTO has cited repeated advisories from the Chinese government urging citizens to avoid travel to Japan. Chinese spending in the July-to-September quarter was 358.3 billion yen, down 39.8%, but the Chinese visitors who did come spent 22.1% more each than a year earlier.
Q. Which country now spends the most in Japan?
A. In the July-to-September 2026 quarter, Taiwan was the biggest source of visitor spending, at 381.8 billion yen, followed by China (358.3 billion), Korea (293.8 billion), the United States (240.9 billion) and Hong Kong (155.5 billion). On a per-person basis, however, European and North American visitors spend much more than East Asian ones: France leads at 423,021 yen per trip.
Q. How much does the average foreign visitor spend in Japan?
A. The Japan Tourism Agency’s first preliminary estimate for July to September 2026 puts average spending per general visitor at 233,677 yen, up 6.1% from a year earlier. For leisure-only visitors it was 222,391 yen, up 8.0%. Preliminary figures are normally revised later. Many travellers take home Japanese stationery and craft items, a category also available outside Japan through importers.
Q. Is the record spending likely to continue in 2027?
A. It depends on three things: the yen, the Chinese market and service capacity. A weak yen has cushioned price rises; if it strengthens, per-head spending may flatten. A recovery in Chinese travel would add volume at a high spend per head, while continued growth in Korea and Taiwan adds volume at lower spend. The government has kept its 2030 targets of 60 million visitors and 15 trillion yen in spending.
Conclusion
The 2026 inbound data corrects a simple story. Japan did not lose its appeal to travellers; it lost one large group of them, and the remaining visitors, in nearly every major market, spent more per person than the year before. The result is a record 7 trillion yen in nine months from 30.7 million visitors, with Taiwan in first place for the quarter, China in second, and an average of about 234,000 yen per trip.
For international operators, the opportunity is no longer in counting visitors but in understanding them: who they are, how much they spend, what they are looking for and where they are going. The brands most likely to do well in this environment are those that sell something specific, price it for value, and meet travellers outside the usual circuit. Those built on volume from a single market face the harder road.
If you’re interested in this topic, the Japanese market more broadly, or what KETCHUPs is working on, we’d love to hear from you — please reach out via our contact form.
Japan Market Pulse is a weekly read on what the Japanese consumer-tech, food, and mobility markets are choosing to do, written for international operators who want to know what is happening before it shows up in the global trade press.
Subscribe at ketchups.co/japan-market-pulse.