

On 2 November 2026, Japan Airlines reported the highest first-half revenue since it returned to the stock market: 1.0989 trillion yen, up 11.7 percent. Operating-level profit, measured as EBIT, fell 36.0 percent to 70.1 billion yen, and net profit dropped 42.2 percent. The cause is not weak demand. Fuel cost 285.6 billion yen, up 47.4 percent, and the airline answered with higher prices, record fuel surcharges and a cargo business that suddenly looks like a second engine. For any operator selling a service while an input cost spikes, this is a rare, well-documented case study of how far pricing can go, and where it stops.
If you have flown between Tokyo and the United States in the last few years, you already know the two things that define Japanese airlines: the service is calm and precise, and the fare you see is not always the fare you pay. In 2026 the second point became a headline. Japan Airlines, usually shortened to JAL, and its rival ANA both raised fuel surcharges on long-haul international tickets to the highest levels ever recorded, as a war in the Middle East pushed up jet fuel prices and a weak yen made every barrel more expensive in local terms.
The half-year results that JAL published on 2 November show what that environment looks like from inside the income statement. Revenue rose by double digits, yet the company carried fewer international passengers than a year earlier, and profit fell by more than a third. That combination, record sales with falling profit, sounds like a contradiction. It is actually a very clear picture of an industry that is passing costs on to customers faster than it is growing volume.
This article walks through the numbers, the pricing mechanism that Japanese carriers use and most Western travellers underestimate, the surprise role of air cargo, and the tourism picture behind the seats. It then pulls out what international operators can learn from a company that managed to grow revenue by 115 billion yen in six months and still watched profit shrink.
Record Sales, Shrinking Profit: The Half-Year in Numbers
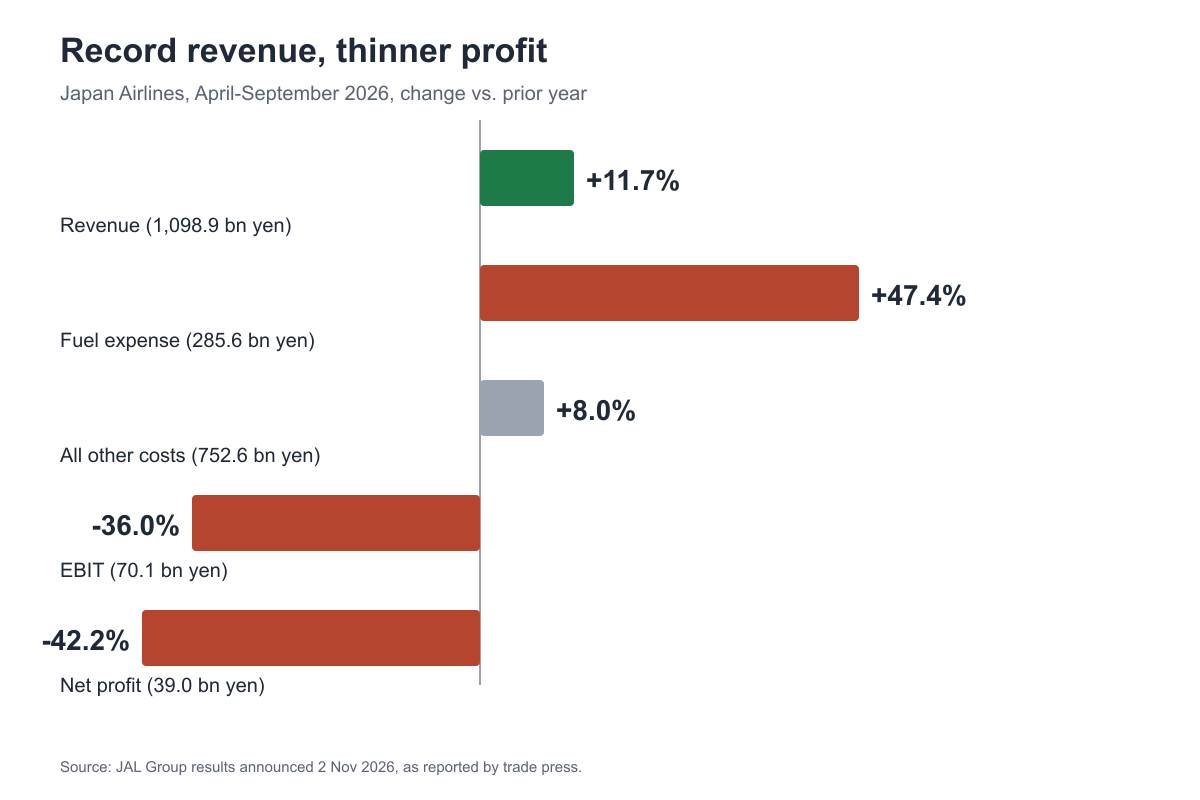
JAL’s fiscal year runs from April to March, so the figures reported on 2 November cover April to September 2026. Here is the headline picture, with changes measured against the same period in 2025.
| Measure | April–September 2026 | Change | |—|—|—| | Revenue | ¥1,098.9 billion | +11.7% | | Operating expenses | ¥1,038.2 billion | +16.5% | | Fuel expense | ¥285.6 billion | +47.4% | | All other costs | ¥752.6 billion | +8.0% | | EBIT | ¥70.1 billion | −36.0% | | EBIT margin | 6.4% | from 11.2% | | EBITDA | ¥156.4 billion | −18.5% | | Net profit | ¥39.0 billion | −42.2% |
Revenue grew by roughly 115 billion yen. Fuel alone grew by roughly 92 billion yen, my own arithmetic from the reported 47.4 percent rise. In other words, about four-fifths of the extra money coming in was absorbed by the single line item the airline controls least. Everything else, including labour, maintenance, landing fees and airport charges, rose 8.0 percent, which is a manageable rate in a country where wage growth is finally real.
What makes the story more interesting is the shape of the half. The first quarter, April to June, was weak. The second quarter, July to September, was much stronger: revenue was 575.2 billion yen, up 12.2 percent, and EBIT was 57.4 billion yen, down only 10.5 percent. If you subtract the second quarter from the half-year total, the first-quarter EBIT comes to roughly 12.7 billion yen, against about 45.6 billion yen a year earlier. By my calculation that is a fall of about 72 percent in the first quarter, narrowing to about 10 percent in the second. Repricing appears to have helped close the gap with fuel.
JAL also said first-half EBIT beat its own initial plan after a weaker start to the year, and it left its full-year forecast unchanged: revenue of 2.095 trillion yen, EBIT of 180.0 billion yen and net profit of 110.0 billion yen. To hit that EBIT target, the second half has to deliver about 110 billion yen, well above the 70.1 billion yen of the first half, which tells you management expects fuel costs and fares to move in its favour.
The Fuel Line: ¥285.6 Billion and Climbing
Fuel is the largest single cost for most airlines, and in Japan it has an extra layer of exposure. Japan imports virtually all of its oil, so jet fuel is priced off the Singapore kerosene market in dollars, and the airlines pay in yen. When oil rises and the yen weakens at the same time, the hit is doubled.
In 2026 both forces were running against the carriers. Fuel expense in the half-year rose 47.4 percent to 285.6 billion yen. The Japanese government stepped in with an emergency subsidy on aircraft fuel, framed as a response to the situation in the Middle East, but a subsidy of that kind softens a blow rather than removing it. According to reporting on the surcharge reset in June, the standard surcharge level that would have applied without the subsidy was 28,000 yen, and with the subsidy it was 25,000 yen.
I find the timing of this squeeze instructive. Fuel prices do not rise politely at the start of a fiscal year. JAL’s first quarter, when fuel costs jumped before fares could respond, was the weakest, and its second quarter, when the surcharges had been in place for weeks, was the strongest. For an operator in any industry, the lesson is that the lag between a cost shock and your pricing response is where the profit disappears. The shorter the lag, the smaller the hole.
The Surcharge Machine: How Japan Sells Fuel Separately
Most Western travellers, and I include myself from my first few years in Japan, are surprised the first time they see a Japanese airline ticket broken into a base fare, a fuel surcharge, taxes and airport fees. At many US carriers, fuel is typically folded into the fare and adjust the fare itself, so the customer sees one number that moves up and down. Japanese carriers, like several European and Asian ones, keep a separate fuel line that they reset on a schedule.
The mechanism is simple. The surcharge is calculated from recent average fuel prices, and it is reset every two months. When fuel is cheap, the surcharge can be small or zero. When fuel spikes, it climbs. The base fare stays comparable and competitive, and the volatile part is shown as a pass-through.
For tickets issued in July and August 2026, ANA and JAL set their surcharges at the highest levels on record. Per passenger, per one-way segment, the published amounts were as follows, with the long-haul tier identical at both airlines and some lower tiers differing slightly:
| Destination region | One-way surcharge | |—|—| | Europe, North America, Middle East, Oceania | ¥65,000 | | Hawaii, India, Indonesia | ¥40,400 | | Thailand, Singapore, Malaysia | ¥33,500 (ANA) / ¥35,000 (JAL) | | Vietnam, Philippines, Guam | ¥22,500 | | China, Taiwan, Hong Kong (ANA) / East Asia (JAL) | ¥15,400 / ¥16,900 | | South Korea | ¥7,400 |
A round trip to North America therefore carried 130,000 yen in fuel surcharges alone, before the base fare and taxes. That is a very large number, and it is part of the reason JAL’s revenue per international passenger rose so sharply. It also explains why the airline can report a drop in profit while saying demand is healthy. The surcharge is revenue, but it exists to cover a cost that arrived first and arrived bigger.
There is a strategic benefit to this structure, and a risk. The benefit is transparency and speed: the airline can pass through a cost increase on a published schedule without repricing every fare. The risk is that customers notice. The same surcharge that protects margin also sits on the screen at the moment of purchase, and when it reaches 65,000 yen one way, some travellers decide to go somewhere cheaper or not go at all.
Pricing Power: ¥110,424 Per International Passenger
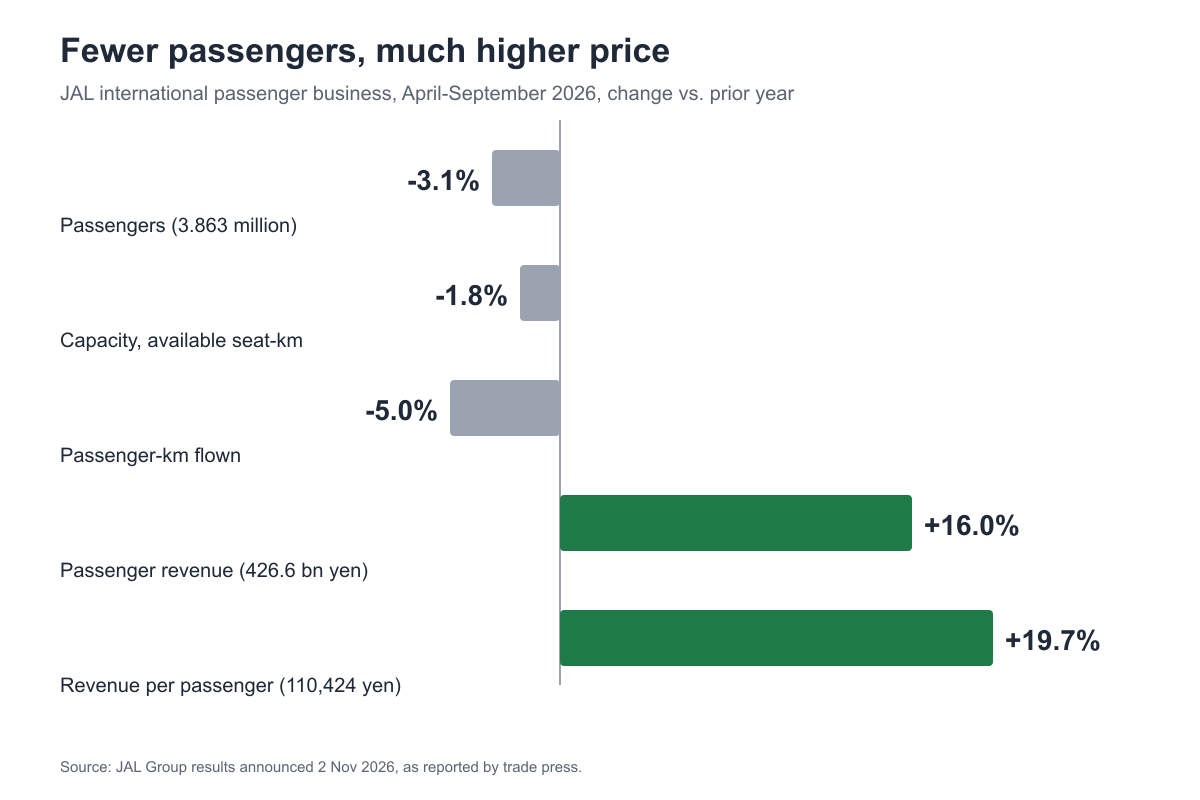
The cleanest illustration of what happened is the international passenger business. In the first half, JAL carried 3.863 million international passengers, down 3.1 percent. International passenger revenue was 426.6 billion yen, up 16.0 percent. Revenue per passenger rose 19.7 percent to 110,424 yen.
The airline also flew less. Capacity, measured in available seat kilometres, fell 1.8 percent, while passenger traffic measured in revenue passenger kilometres fell 5.0 percent, so the load factor slipped 2.7 percentage points to 82.8 percent. In the July to September quarter the pattern was stronger still: revenue per passenger reached 112,205 yen, up 24.7 percent, while passenger numbers fell 5.7 percent and the load factor was 80.7 percent.
Domestic flights told a milder version of the same story. Domestic revenue rose 5.8 percent to 319.7 billion yen, passengers fell 2.2 percent to 18.698 million, and revenue per passenger rose 8.2 percent to 17,098 yen. The load factor held at 82.8 percent.
Put simply, JAL is selling fewer seats at much higher prices. That is a rational choice when a cost shock hits and capacity is constrained, but it is also a bet. If fuel prices fall, the surcharges will fall with them and revenue per passenger will come down. If demand weakens further, a higher price on a smaller number of passengers becomes harder to sustain. A load factor in the low 80s is healthy for an airline, yet it is a few points lower than a year ago.
The Surprise Engine: Air Cargo Up 46.8%
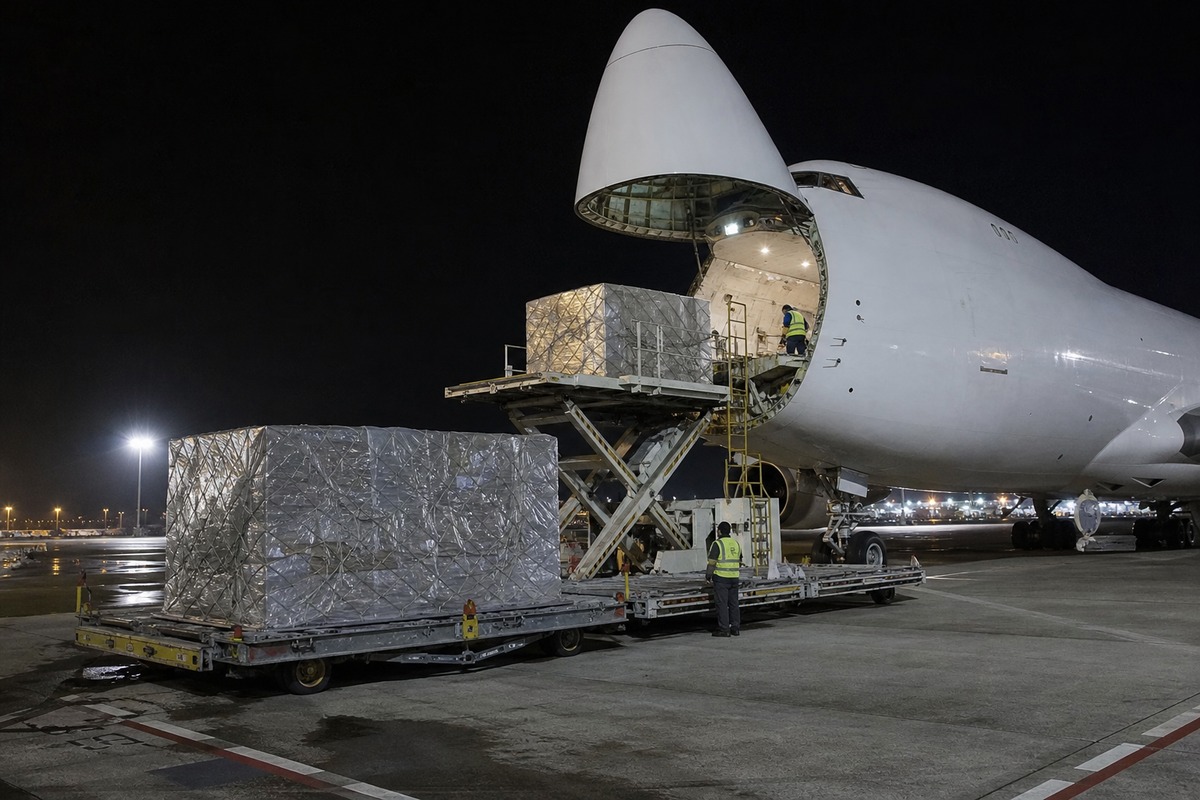
If passengers were the story of the last decade, cargo is the story of this half-year. JAL’s international cargo revenue was 103.9 billion yen, up 46.8 percent, and in the second quarter it was 51.2 billion yen, up 38.1 percent. Tonnage carried rose 6.7 percent to 312,000 tonnes, but the revenue per kilogram jumped 37.6 percent to 332 yen. Prices, not volume, did most of the work, and they were helped by strong demand on the Asia to North America lane that the report links partly to AI-related shipments.
That connection is worth pausing on. The servers, accelerators, networking gear and components that fill AI data centres move by air because they are high-value, time-sensitive and fragile. When those shipments surge, freighter and belly capacity become scarce, and rates rise. Japan sits at the heart of the supply chain for many of the semiconductors and precision parts involved, and its airlines are well placed to carry them.
ANA, JAL’s larger rival, is seeing the same effect. Its first-quarter results in July showed record first-quarter revenue of 672.7 billion yen and operating income of 20.7 billion yen. International passenger revenue was up 20 percent, and international cargo revenue was about 2.6 times the previous year’s level, helped by its consolidation of Nippon Cargo Airlines and semiconductor-related demand. ANA said it offset much of the fuel impact through dynamic pricing.
I would not call this a permanent shift. Cargo rates are notoriously volatile, and a slowdown in AI hardware spending would reverse them quickly. But as a hedge against a bad passenger quarter, cargo has done exactly what its backers promised. It is a second revenue stream whose cycle is not identical to leisure travel.
The Missing Chinese Visitors, and Who Filled the Seats
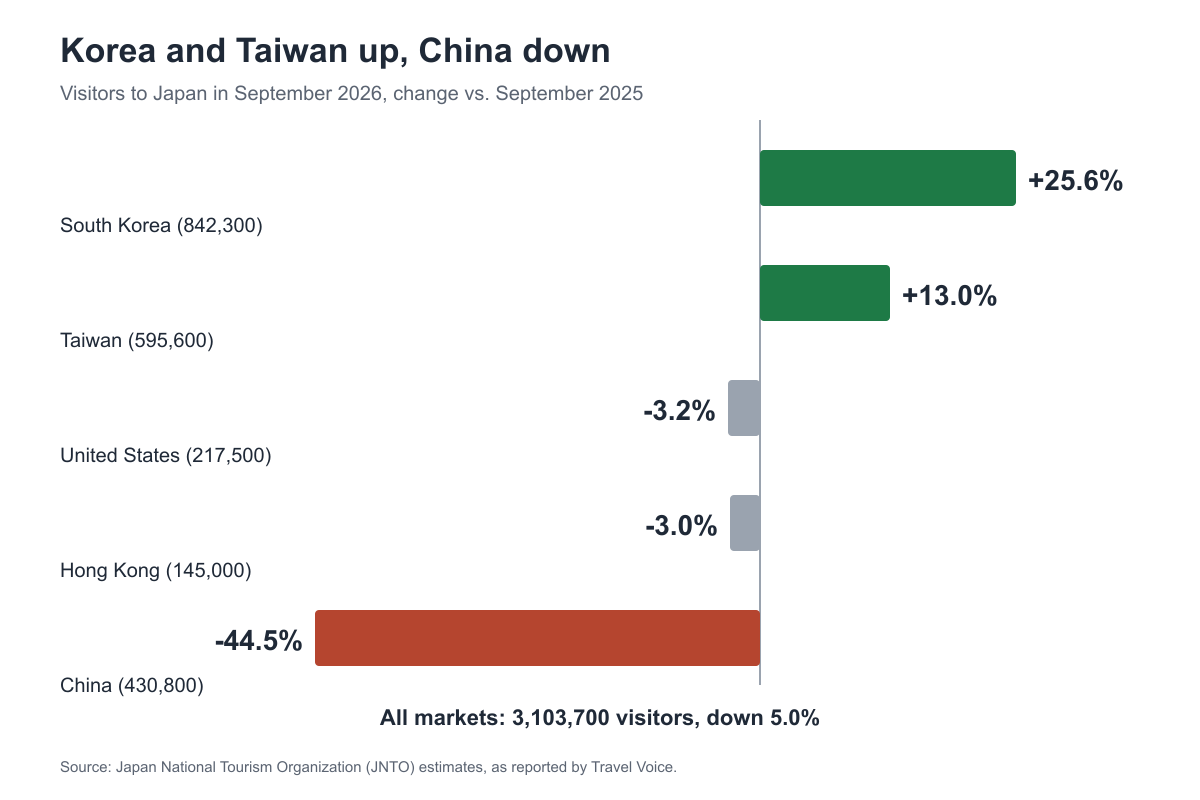
Behind the seat numbers sits a tourism story that every operator in Japan has been watching. In September 2026, 3,103,700 international visitors arrived in Japan, according to the Japan National Tourism Organization. That was down 5.0 percent from a year earlier, the second straight monthly decline. For January to September, arrivals were 30,730,200, down 2.9 percent.
The decline is not evenly distributed. China, which was the largest source market before the current dispute, sent 430,800 visitors in September, down 44.5 percent. Beijing’s travel advisory has not been lifted, and the number of flights from China remains sharply reduced. The United States sent 217,500, down 3.2 percent, and Hong Kong sent 145,000, down 3.0 percent.
Against that, South Korea sent 842,300 visitors, up 25.6 percent, and Taiwan sent 595,600, up 13 percent. September set records for arrivals from South Korea, Taiwan, Singapore, India, Mexico, Russia and the Middle East. The Asian Games in Aichi helped, and JNTO listed typhoon-related flight cancellations, higher airfares and the large drop in flights from China as reasons for weaker demand overall.
Higher airfares appear on that list for a reason. The same fuel surcharges that rescued JAL’s revenue are among the costs of travelling to Japan. The airline’s ground handling, travel and related business reported revenue down 7.1 percent, partly because overseas carriers cut flights in East Asia and the Middle East.
For JAL, the market mix matters more than the total. Japanese airlines earn their best margins from long-haul premium travellers and from inbound traffic that fills the return legs. A visitor from Seoul or Taipei flies a short route on a lower fare. A visitor from New York or Los Angeles flies a long route at a much higher fare and often pays the full surcharge. When growth comes from the short routes and decline comes from the long ones, revenue per passenger can still rise, but only because fares have risen, not because the mix has improved.
Premium Cabins, Lounges and a Brand Refresh

JAL did not just raise prices and wait. The report and recent announcements show an airline investing in the part of the business where customers are willing to pay.
At ZIPAIR, its low-cost long-haul brand, international revenue was 42.9 billion yen, up 12.3 percent, and passengers rose 5.3 percent to 710,000. The load factor jumped to 87.8 percent from 73.7 percent while capacity fell 9.7 percent. JAL credits free-to-use Starlink internet service and flexible pricing. ZIPAIR added a Narita to Kuala Lumpur route in October.
At SPRING JAPAN, the low-cost carrier focused on China, the picture is the opposite: passengers fell 21.6 percent to 452,000, but revenue per passenger rose 36.0 percent to 29,237 yen, which kept revenue up 6.6 percent at 13.2 billion yen.
On the ground, JAL reopened the domestic lounges in Haneda Terminal 1 North Wing on 8 October and increased First Class Lounge seating by about 40 percent. On 26 October it announced a brand refresh, with the first aircraft in the new SPRING JAPAN livery expected by the end of 2026. On 3 September it signed a strategic partnership memorandum with Korean Air.
The group’s mileage, finance and commerce segment is quietly doing the heavy lifting in profit terms. It generated 121.6 billion yen in revenue, up 12.7 percent, and 22.2 billion yen in EBIT, up 5.4 percent, while the main airline segment’s EBIT fell 45.3 percent to 41.6 billion yen. Non-aviation mileage revenue rose from 51.0 billion yen to 59.4 billion yen, and JAL plans to extend its Mileage Bank to FHG Hotels. A loyalty programme that earns money whether or not the fuel price spikes is the closest thing an airline has to a hedge.
Finally, the balance sheet. Cash and deposits stood at 1.034 trillion yen at the end of September, and interest-bearing debt fell to 737.8 billion yen from 875.9 billion yen. Operating cash flow was 160.0 billion yen, but investing outflow almost doubled to 151.9 billion yen, so free cash flow dropped to 8.0 billion yen from 77.0 billion yen. JAL is spending on aircraft and can afford to: cash and deposits actually rose to 1.034 trillion yen, but free cash flow shrank sharply as investment climbed.
What International Operators Can Take From JAL
I have lived in Japan for two decades, and every time a shock hits, from currency swings to disasters, I notice that Japanese companies respond with a particular mix of caution and quiet precision. JAL’s half-year is a good example. Five lessons stand out.
Separate the volatile cost from the base price. The fuel surcharge lets JAL keep its headline fare comparable while passing through an input it cannot control. Operators in logistics, food, energy-intensive manufacturing or software with usage-based infrastructure costs can use the same logic. A visible, rules-based adjustment is easier to defend than a surprise price rise.
Shorten the lag. JAL’s weak first quarter and stronger second quarter show how much profit a delay in repricing costs. If your pricing review cycle is annual and your costs move monthly, you are funding your customers’ stability with your own margin.
Value beats volume when costs spike. Revenue per international passenger rose 19.7 percent while passengers fell 3.1 percent. Cutting low-margin volume and raising yield is not a failure of growth. It is a deliberate allocation of scarce capacity.
Build a second engine with a different cycle. Cargo, mileage and finance all earn money for reasons unrelated to leisure demand. The best defence against a bad quarter in your core product is a profitable business whose customers are different.
Watch your source-market mix. A 44.5 percent fall in Chinese arrivals, offset by a 25.6 percent rise from Korea, kept total arrivals close to flat in most months. It is a reminder that concentration risk is real, and that diversified demand is a strategic asset, not a nice-to-have.
Frequently Asked Questions
Q. Why did Japan Airlines’ profit fall if revenue hit a record?
A. Costs grew faster than revenue. Fuel expense rose 47.4 percent to 285.6 billion yen, and other costs rose 8.0 percent, so EBIT fell 36.0 percent even as revenue increased 11.7 percent. A weak yen and the situation in the Middle East raised the cost of fuel, and fares took several weeks to catch up.
Q. How big are the fuel surcharges on flights from Japan?
A. For tickets issued in July and August 2026, ANA and JAL set record surcharges of 65,000 yen per passenger, one way, on routes to Europe, North America, the Middle East and Oceania. Hawaii, India and Indonesia carried 40,400 yen, and South Korea 7,400 yen. Surcharges are reset every two months, so check the current level on the airline’s website before you book.
Q. Is tourism to Japan still growing?
A. Not at the moment. Japan received 3,103,700 international visitors in September 2026, down 5.0 percent year on year, and 30,730,200 in the first nine months, down 2.9 percent. China is down sharply, while South Korea and Taiwan are at record highs.
Q. Is ANA seeing the same pattern as JAL?
A. Partly. ANA reported record first-quarter revenue of 672.7 billion yen in July, with international passenger revenue up 20 percent and international cargo revenue about 2.6 times the previous year, but its operating income was a modest 20.7 billion yen because of higher fuel costs. I could not confirm ANA’s first-half figures from the company’s own release at the time of writing.
Conclusion
Japan Airlines’ April to September results are a compact lesson in how much a well-run company can do when a cost shock arrives, and how little it can do to make the shock disappear. Revenue climbed to a first-half record of 1.0989 trillion yen. Pricing power was visible in a 19.7 percent rise in revenue per international passenger. Cargo, mileage and finance provided a cushion. Even so, a 47.4 percent jump in fuel expense pulled EBIT down 36.0 percent.
The next two quarters will tell whether the squeeze is easing. JAL has told investors it still expects 180.0 billion yen of EBIT for the full year, which means the second half must nearly double the first. That depends on fuel prices, the yen, the pace of cargo demand and the return, or not, of Chinese visitors. For international operators the practical takeaway is not about aircraft. It is that in a cost shock, speed of repricing, a visible pass-through and a second revenue engine decide how much of your revenue growth you actually keep.
If you’re interested in this topic, the Japanese market more broadly, or what KETCHUPs is working on, we’d love to hear from you — please reach out via our contact form.
Japan Market Pulse is a weekly read on what the Japanese consumer-tech, food, and mobility markets are choosing to do, written for international operators who want to know what is happening before it shows up in the global trade press.
Subscribe at ketchups.co/japan-market-pulse.