


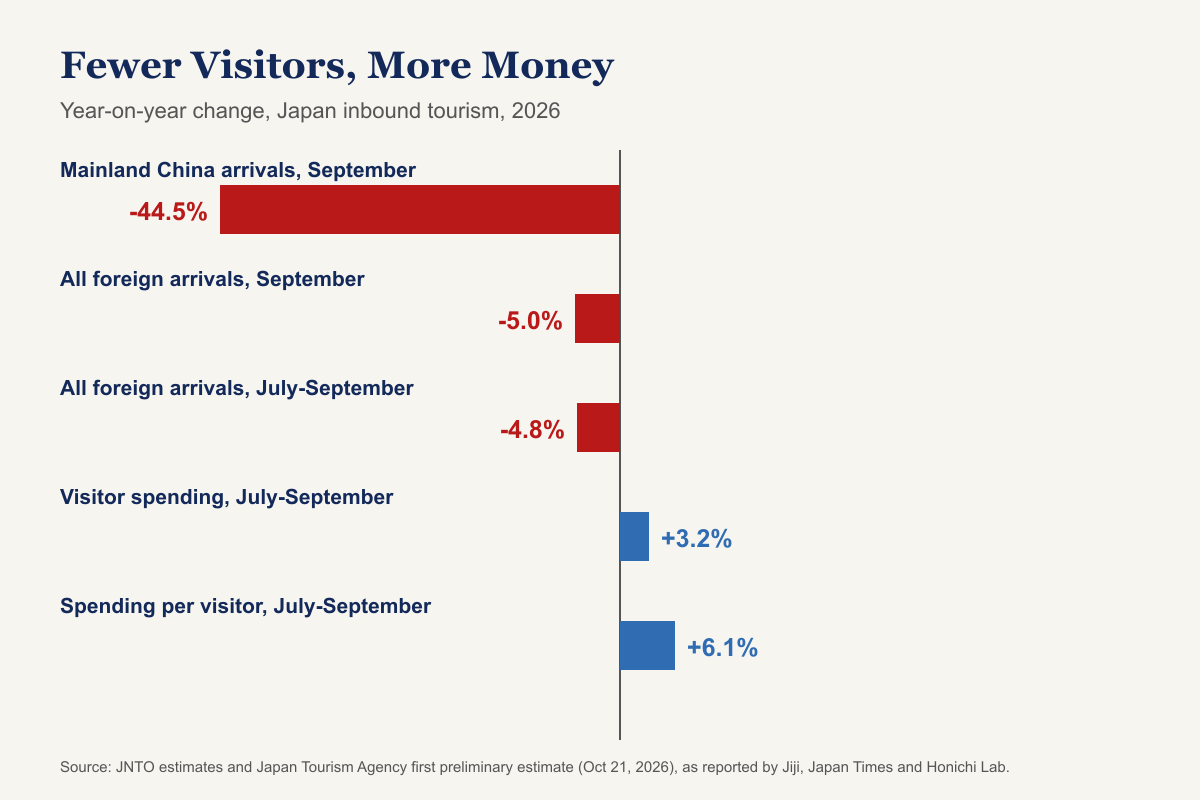
For most of the last decade, the story of Japanese tourism was simple: more people, more money. In 2026 the two lines have split. Japan received about 3.10 million foreign visitors in September, down 5.0% from a year earlier, according to estimates from the Japan National Tourism Organization (JNTO). It followed a 9.6% drop in August. Arrivals from mainland China fell 44.5%.
Yet on the same day those figures came out, October 21, the Japan Tourism Agency reported that foreign visitors spent an estimated ¥2.21 trillion (about $13.9 billion) in July to September, up 3.2% year on year. For January to September, preliminary spending reached about ¥7.06 trillion, the highest on record for that period, even though arrivals were down 2.9%.
Fewer visitors, more yen. This article looks at how that happened, which markets replaced the missing Chinese travellers, why each visitor is now spending more, and what the shift means for international companies that sell to tourists in Japan or plan to.
Fewer Visitors, More Spending: The Numbers
Start with the headline figures, because they are unusually clean.
Arrivals. JNTO estimates 3,103,700 foreign visitors in September 2026, down 5.0%. The January to September total was 30,730,200, down 2.9%, although it still passed 30 million for the second year in a row. JNTO pointed to higher airfares linked to the worsening situation in the Middle East and to typhoon-related flight cancellations, on top of the fall in Chinese travel.
Spending. The Japan Tourism Agency’s first preliminary estimate for the third quarter puts total inbound travel consumption at ¥2,207.6 billion, up 3.2%. Spending per visitor rose 6.1% to ¥233,677. That is the key number. Arrivals in the quarter were down about 4.8%, and per-visitor spending more than made up for it.
The year so far. The first nine months of 2026 brought about ¥7.06 trillion in visitor spending, according to Kyodo’s report of the agency’s figures, a record for the period. April to June alone produced about ¥2.51 trillion, the highest ever for a second quarter.
Put simply, Japan’s tourism economy did not shrink when its single largest source market pulled back. It changed shape.
Where the Chinese Visitors Went, and Who Replaced Them
The fall in Chinese travel is large and politically driven. Arrivals from mainland China were 430,800 in September, down 44.5%, and down 55.5% for the first nine months of the year, according to Global Times’ summary of JNTO data. JNTO links the drop to the Chinese government’s advisory against travel to Japan, issued after a diplomatic dispute over remarks by Prime Minister Sanae Takaichi about Taiwan, and to reduced air services between the two countries.
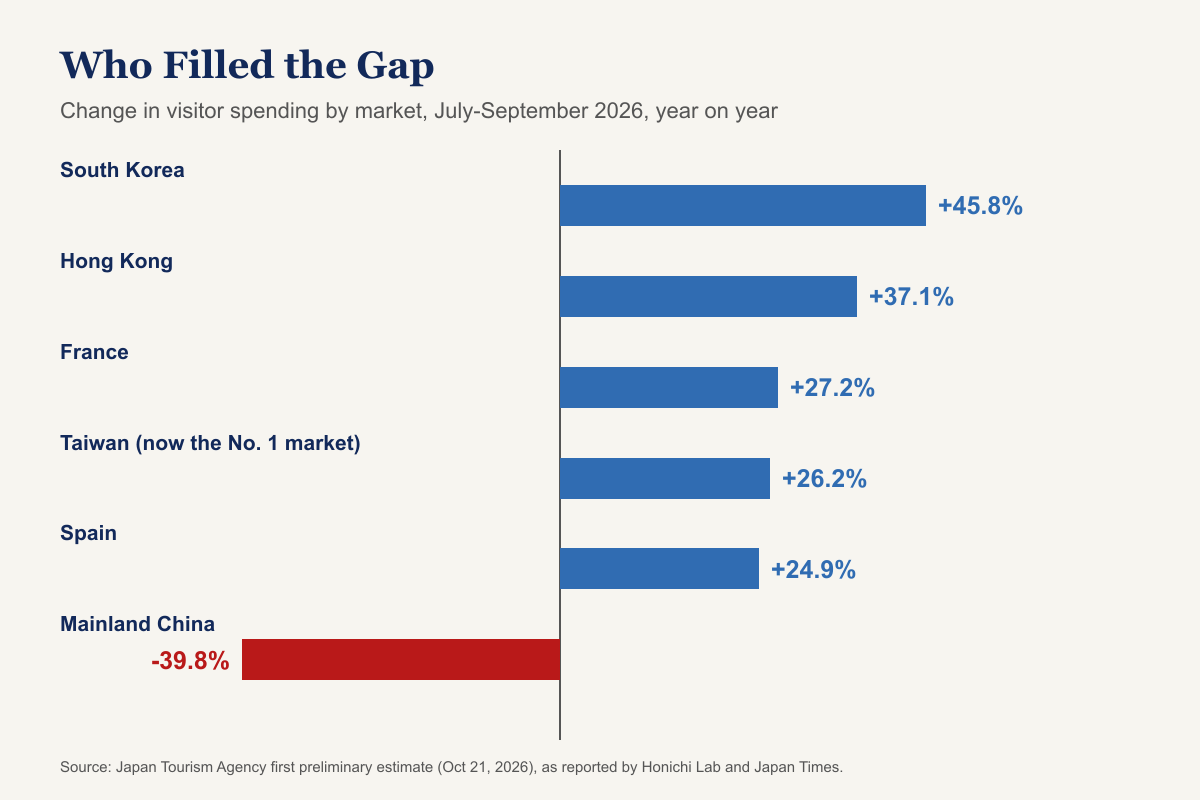
In spending terms, Chinese visitors spent ¥358.3 billion in July to September, down 39.8% from about ¥595 billion a year earlier. China’s share of total visitor spending fell to 16.2%. For the first time in a long while, China was not the largest market by spending.
That position went to Taiwan. Taiwanese visitors spent ¥381.8 billion in the quarter, up 26.2%, for a 17.3% share. South Korea was third at ¥293.8 billion, up 45.8%, the fastest growth among the big markets. The United States was fourth at ¥240.9 billion, a 10.9% share, and Hong Kong fifth at ¥155.5 billion, up 37.1%. The top five accounted for more than 60% of all spending.
Arrival data tells the same story. In September, South Korean arrivals rose 25.6% to 842,300 and Taiwanese arrivals rose 13.0% to 595,600, both records for the month. Korean demand was helped by the Chuseok holiday and added airline capacity. JNTO said seven markets, including South Korea, Mexico and the Middle East, recorded their highest-ever September arrivals. American arrivals were 217,500, down 3.2%; JNTO cited higher airfares and typhoon-related cancellations among the factors behind the overall September decline.
Europe was smaller but grew fast. In the third quarter, visitor spending was up 27.2% from France, 24.9% from Spain, 22.2% from Italy and 11.5% from the United Kingdom, as reported by Honichi Lab from the agency’s release.
The important point for operators is that the replacement markets are not the same customer. A Korean visitor on a three-night Osaka trip and a French visitor on a two-week tour of Kyoto and the Japanese Alps spend in very different ways, and both are different from the Chinese group and family travel that shaped Japanese retail in the 2010s.
Why Each Visitor Is Spending More

If arrivals fell and spending rose, the gap is explained by spending per head. Several forces are pushing it up at once.
The visitors who still come from China are spending far more. Per-person spending by Chinese visitors rose 22.1% to ¥294,560 in the third quarter. A plausible reading is that the advisory has filtered out the most price-sensitive group and package travellers, while independent and higher-income travellers, who are less affected by official guidance and more able to absorb higher airfares, continue to come. The total from China is smaller, but each traveller is worth more.
Long-haul visitors spend the most. The highest per-person spending in the quarter came from France, at ¥423,021. European and North American visitors tend to stay longer and spend more on accommodation, transport and experiences. As they make up a larger share of the mix, the average rises.
Accommodation is now the biggest line. Per-person spending on accommodation was ¥82,523, ahead of shopping at ¥64,367 and food and drink at ¥53,600. That order matters. For years, Japanese inbound retail was synonymous with bakugai, the shopping sprees of the 2010s. Today, the largest share of each visitor’s money goes to where they sleep, and hotel room rates in Tokyo, Kyoto and Osaka have generally risen since travel reopened.
Prices are higher, but the yen is still weak. Hotels, restaurants and attractions in Japan have raised prices, and some sites have introduced separate or higher prices for foreign visitors. Because the yen remains weak by historical standards, many visitors from the US, Europe and Taiwan still find Japan good value even at those higher prices. Part of the rise in per-person spending is therefore inflation, not more consumption, and that should be kept in mind when reading the record totals.
One number goes the other way. The average stay in the third quarter was 10.3 nights, 1.2 nights shorter than a year earlier. Visitors are spending more per trip in less time. That points to more short, intensive trips from nearby markets such as Korea and Taiwan, combined with higher daily spending from long-haul visitors.
It is worth spelling out the arithmetic, because it explains the whole year. If arrivals fall by about 5% and spending per visitor rises by about 6%, total spending still grows. Japan did not need every lost Chinese traveller to be replaced by another visitor. It needed the visitors who did come to spend a little more each, and they did. The danger in that arithmetic is also clear: a market held up by rising spending per head is more exposed to anything that makes trips more expensive or shorter, such as higher airfares, a stronger yen or new taxes and fees.
What Changed on the Ground

The shift in source markets is already visible in how Japanese businesses operate.
Department stores feel it first. Duty-free sales at major department stores were among the most China-exposed parts of Japanese retail, built around luxury goods, cosmetics and watches. When Chinese arrivals fall by half, those counters feel it immediately, even when national visitor spending holds up. A record national total does not mean every tourist-facing business is having a record year.
Hotels and experiences benefit. With accommodation the biggest spending category, hotel operators, ryokan inns and experience businesses (guided tours, food experiences, cultural activities) are better placed than shops whose sales depend on one nationality.
The mix of languages and payment habits is changing. A store designed around Chinese-language staff and Chinese mobile payment apps has a different customer in front of it when Korean, Taiwanese and Western visitors make up the majority. Many operators report that Korean and Taiwanese visitors are often repeat travellers who know Japan well, research on social media in their own languages, and move quickly between neighbourhood shops, cafes and restaurants rather than large flagship stores.
Restaurants and food experiences gain. Food and drink was the third-largest spending category per visitor in the quarter. For many Korean and Taiwanese repeat visitors, the main purpose of a short trip is to eat: a specific ramen shop, a regional dish, a seasonal dessert. Restaurants that are easy to find and book from overseas, and that can serve guests who do not speak Japanese, are capturing a growing share of that spending. The same is true of food tours, cooking classes and market visits, which turn a meal into an experience that can be priced at a premium.
Regional Japan has more room to grow. When the visitor mix shifts towards repeat travellers and long-stay visitors, demand spreads beyond the main cities. That is good news for regional hotels, transport operators and local producers, but it also requires investment in information, signage, payments and staffing outside the big cities, where many businesses are still not set up for foreign customers.
Tax-free shopping is about to change. From November 1, 2026, Japan moves from point-of-sale tax exemption to a refund system, where visitors pay consumption tax at the till and claim it back when they leave. Under the system in place through October 31, eligible visitors generally show their passport at a participating store to buy tax-free. The change could cool impulse shopping slightly and gives retailers new operational work at exactly the moment their customer mix is shifting.
What International Operators Should Take From This
If your business sells to visitors in Japan, or is considering it, the 2026 numbers carry several practical lessons.
Do not build on one source market. The Chinese advisory showed how quickly political decisions can remove a large share of demand. The businesses that held up best this year were those already serving several markets. Diversification across Taiwan, Korea, Southeast Asia, the US and Europe is no longer a nice-to-have.
Price on value, not volume. A Japanese tourism economy with fewer but higher-spending visitors rewards products and experiences that justify a higher price: quality accommodation, guided and private experiences, food, and goods with a clear story of craft or origin. It is less kind to strategies that depend on large numbers of low-margin transactions.
Localise beyond language. Taiwanese, Korean and American visitors use different platforms to plan trips, pay with different methods, and respond to different messaging. Treat each as its own market, with its own channels, rather than translating one set of materials into several languages.
Read the totals carefully. Record spending includes higher hotel rates and general price increases. When you model demand for your own product, separate the number of visitors you can reach from the price inflation in the headline figure. A record in yen is not the same as a record in customers.
Plan for policy changes. The tax-free refund system starting November 1 is a reminder that the rules around inbound tourism are still moving. Any business plan that depends on tourist shopping should include a view on regulation.
A Market-by-Market Playbook
The numbers suggest that “the inbound tourist” is no longer a useful planning unit. The opportunity looks different depending on which market you serve. The notes below are practical observations for operators rather than findings from the agency’s data.
Taiwan: the loyal repeat visitor. Taiwan was the largest market by spending in July to September 2026, and many Taiwanese travellers have visited Japan several times. Repeat visitors tend to move beyond Tokyo, Kyoto and Osaka towards regional cities, local food and seasonal events. For operators, that means regional distribution, seasonal products and content that rewards people who already know the obvious places. Generic “first trip to Japan” messaging is less effective with this group.
South Korea: short trips, high frequency. Korean demand grew fastest in the quarter. Flights are short and plentiful, and many trips are weekend or long-weekend breaks, often to Osaka, Fukuoka or Tokyo. The value of each trip is lower than for long-haul visitors, but the frequency is high. That rewards businesses that are easy to discover on Korean-language social media and map apps, that are quick to buy from, and that give people a reason to come back on the next trip.
United States: high spend, price sensitive to airfare. American visitors are the fourth-largest market by spending, but September arrivals dipped as airfares rose. US travellers tend to stay longer, spend heavily on hotels, transport and guided experiences, and plan further ahead. For operators, early visibility in trip planning matters more than street-level promotion, and premium experiences are often a better fit than discounted goods.
Europe: small volume, highest value per head. France recorded the highest spending per visitor in the quarter, and spending from France, Spain and Italy grew by more than a fifth. European visitors often take long trips with a strong interest in culture, food and craft. Their numbers are small, but they reward depth: storytelling, provenance and quality over volume.
China: smaller, wealthier, and politically sensitive. The remaining Chinese visitors spend more per head than before. Operators that kept Chinese-language service and payments are serving a smaller but more valuable group, and they will be best placed if travel recovers. The practical lesson is to keep the capability, but not to plan the business around a fast return.
None of these groups is a substitute for the others. A store, hotel or brand that tries to serve all of them with one message will usually serve none of them well. The most resilient operators in 2026 are those that know which two or three markets they actually win in, and build their channels, language, payment options and products around those customers.
What to Watch Next
Three signals will show whether this new pattern lasts.
The first is Chinese travel policy. Any easing of Beijing’s advisory, or restoration of flights, could bring a fast rebound, because Chinese demand for Japan travel has historically been strong. A further deterioration would test how far other markets can keep filling the gap.
The second is the effect of the tax-free refund system on shopping spending in November and December. If shopping per visitor drops sharply, the agency’s fourth-quarter estimate will show it.
The third is full-year spending. With about ¥7.06 trillion recorded in nine months, 2026 is on course for another annual record, measured against the government’s goal of ¥15 trillion in visitor spending and 60 million visitors a year by 2030. How close the country gets depends on whether high-spending visitors keep coming as prices rise.
A note on the figures: the spending data are first preliminary estimates and will be revised. The January to September total is reported by Kyodo; one outlet printed a different figure, so treat the exact nine-month number as provisional. Some country-level figures come from secondary reports of the agency’s release.
Frequently Asked Questions
Q. How many foreign visitors arrived in Japan in September 2026?
A. About 3.10 million, down 5.0% from a year earlier, according to JNTO estimates, after a 9.6% fall in August. The January to September total was about 30.73 million, down 2.9%.
Q. How much did foreign visitors spend in Japan in July to September 2026?
A. About ¥2.21 trillion, up 3.2% year on year, according to the Japan Tourism Agency’s first preliminary estimate. Spending per visitor rose 6.1% to ¥233,677.
Q. Why did Chinese tourism to Japan fall in 2026?
A. JNTO links the decline to the Chinese government’s advisory against travel to Japan and to reduced flights between the two countries. Chinese arrivals fell 44.5% in September and 55.5% for the first nine months of the year.
Q. Which countries spend the most in Japan now?
A. In July to September 2026, Taiwan was the top market by spending at ¥381.8 billion, followed by China, South Korea, the United States and Hong Kong. Korean spending grew fastest among the large markets, up 45.8%.
Q. Why is spending per visitor rising in Japan?
A. Spending per visitor rose 6.1% to ¥233,677 in July to September. Remaining Chinese visitors are spending more per person, long-haul visitors from Europe and the US spend heavily, accommodation costs have risen, and part of the increase reflects higher prices rather than more consumption.
Q. What does this mean for businesses that sell to tourists in Japan?
A. The market is shifting from volume to value and from one dominant source market to several. Businesses should diversify across markets, localise for each nationality, and separate real demand growth from price inflation in headline figures.
Conclusion
In 2026, Japan’s inbound tourism market lost more than half of its Chinese visitors over nine months and still set a spending record. That is not a sign that nothing changed. It is a sign that the market changed underneath the headline: Taiwan and Korea grew, long-haul visitors spent more, accommodation overtook shopping, and higher prices lifted every total.
For international operators, the lesson is that Japan’s tourism economy is more resilient than a single-market view suggests, and more demanding. The visitors who now drive spending stay in better hotels, look for experiences, and come from many different places. Companies that understand those customers one market at a time will find more opportunity in Japan’s inbound economy than the arrival numbers alone suggest.
If you’re interested in this topic, the Japanese market more broadly, or what KETCHUPs is working on, we’d love to hear from you — please reach out via our contact form.
Japan Market Pulse is a weekly read on what the Japanese consumer-tech, food, and mobility markets are choosing to do, written for international operators who want to know what is happening before it shows up in the global trade press.
Subscribe at ketchups.co/japan-market-pulse.